

5.2.2 Long-Term Change in Aerosol Optical
Depth
Long-term changes in aerosol loading over the Indian subcontinent have been estimated using ground-based single
station measurements (Dani et al. 2012; Kaskaoutis et al.
2012) as well as multi-station long-term (>25 years for some
stations) ground-based observational network database
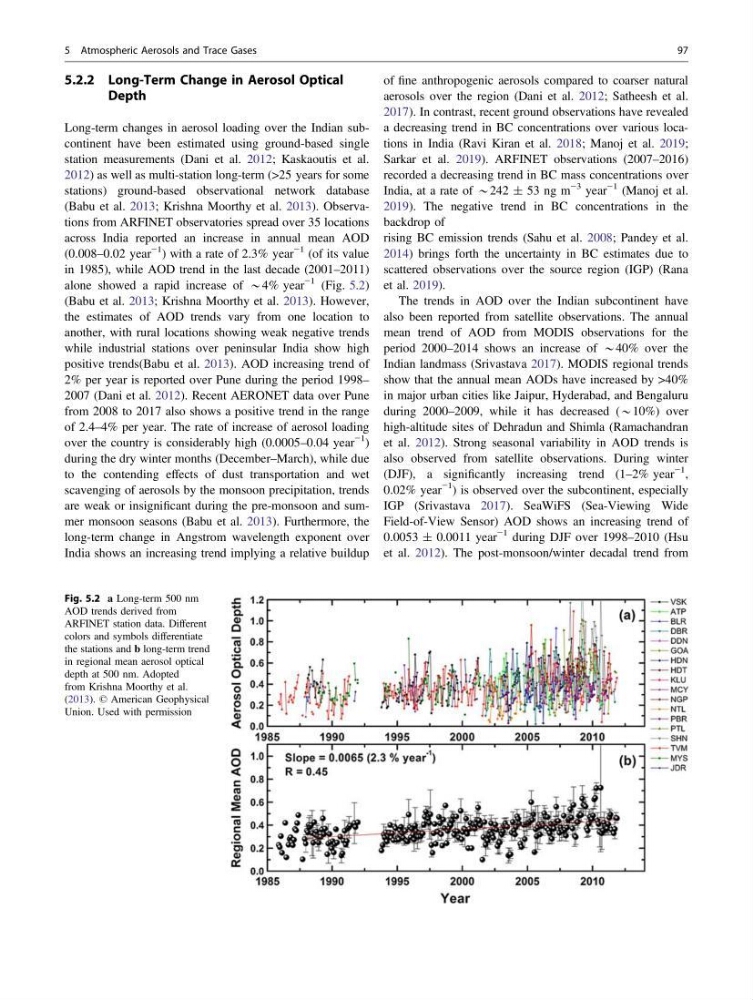
(Babu et al. 2013; Krishna Moorthy et al. 2013). Observations from ARFINET observatories spread over 35 locations
across India reported an increase in annual mean AOD
(0.008–0.02 year
−1 ) with a rate of 2.3% year
−1 (of its value
in 1985), while AOD trend in the last decade (2001–2011)
alone showed a rapid increase of *4% year
−1 (Fig. 5.2)
(Babu et al. 2013; Krishna Moorthy et al. 2013). However,
the estimates of AOD trends vary from one location to
another, with rural locations showing weak negative trends
while industrial stations over peninsular India show high
positive trends(Babu et al. 2013). AOD increasing trend of
2% per year is reported over Pune during the period 1998–
2007 (Dani et al. 2012). Recent AERONET data over Pune
from 2008 to 2017 also shows a positive trend in the range
of 2.4–4% per year. The rate of increase of aerosol loading
over the country is considerably high (0.0005–0.04 year
−1 )
during the dry winter months (December–March), while due
to the contending effects of dust transportation and wet
scavenging of aerosols by the monsoon precipitation, trends
are weak or insignificant during the pre-monsoon and summer monsoon seasons (Babu et al. 2013). Furthermore, the
long-term change in Angstrom wavelength exponent over
India shows an increasing trend implying a relative buildup
of fine anthropogenic aerosols compared to coarser natural
aerosols over the region (Dani et al. 2012; Satheesh et al.
2017). In contrast, recent ground observations have revealed
a decreasing trend in BC concentrations over various locations in India (Ravi Kiran et al. 2018; Manoj et al. 2019;
Sarkar et al. 2019). ARFINET observations (2007–2016)
recorded a decreasing trend in BC mass concentrations over
India, at a rate of *242 ± 53 ng m
−3 year
−1 (Manoj et al.
2019). The negative trend in BC concentrations in the
backdrop of
rising BC emission trends (Sahu et al. 2008; Pandey et al.
2014) brings forth the uncertainty in BC estimates due to
scattered observations over the source region (IGP) (Rana
et al. 2019).
The trends in AOD over the Indian subcontinent have
also been reported from satellite observations. The annual
mean trend of AOD from MODIS observations for the
period 2000–2014 shows an increase of *40% over the
Indian landmass (Srivastava 2017). MODIS regional trends
show that the annual mean AODs have increased by >40%
in major urban cities like Jaipur, Hyderabad, and Bengaluru
during 2000–2009, while it has decreased (*10%) over
high-altitude sites of Dehradun and Shimla (Ramachandran
et al. 2012). Strong seasonal variability in AOD trends is
also observed from satellite observations. During winter
(DJF), a significantly increasing trend (1–2% year
−1 ,
0.02% year
−1 ) is observed over the subcontinent, especially
IGP (Srivastava 2017). SeaWiFS (Sea-Viewing Wide
Field-of-View Sensor) AOD shows an increasing trend of
0.0053 ± 0.0011 year
−1 during DJF over 1998–2010 (Hsu
et al. 2012). The post-monsoon/winter decadal trend from
Fig. 5.2 a Long-term 500 nm
AOD trends derived from
ARFINET station data. Different
colors and symbols differentiate
the stations and b long-term trend
in regional mean aerosol optical
depth at 500 nm. Adopted
from Krishna Moorthy et al.
(2013). © American Geophysical
Union. Used with permission
5 Atmospheric Aerosols and Trace Gases
97
Depth
Long-term changes in aerosol loading over the Indian subcontinent have been estimated using ground-based single
station measurements (Dani et al. 2012; Kaskaoutis et al.
2012) as well as multi-station long-term (>25 years for some
stations) ground-based observational network database
(Babu et al. 2013; Krishna Moorthy et al. 2013). Observations from ARFINET observatories spread over 35 locations
across India reported an increase in annual mean AOD
(0.008–0.02 year
−1 ) with a rate of 2.3% year
−1 (of its value
in 1985), while AOD trend in the last decade (2001–2011)
alone showed a rapid increase of *4% year
−1 (Fig. 5.2)
(Babu et al. 2013; Krishna Moorthy et al. 2013). However,
the estimates of AOD trends vary from one location to
another, with rural locations showing weak negative trends
while industrial stations over peninsular India show high
positive trends(Babu et al. 2013). AOD increasing trend of
2% per year is reported over Pune during the period 1998–
2007 (Dani et al. 2012). Recent AERONET data over Pune
from 2008 to 2017 also shows a positive trend in the range
of 2.4–4% per year. The rate of increase of aerosol loading
over the country is considerably high (0.0005–0.04 year
−1 )
during the dry winter months (December–March), while due
to the contending effects of dust transportation and wet
scavenging of aerosols by the monsoon precipitation, trends
are weak or insignificant during the pre-monsoon and summer monsoon seasons (Babu et al. 2013). Furthermore, the
long-term change in Angstrom wavelength exponent over
India shows an increasing trend implying a relative buildup
of fine anthropogenic aerosols compared to coarser natural
aerosols over the region (Dani et al. 2012; Satheesh et al.
2017). In contrast, recent ground observations have revealed
a decreasing trend in BC concentrations over various locations in India (Ravi Kiran et al. 2018; Manoj et al. 2019;
Sarkar et al. 2019). ARFINET observations (2007–2016)
recorded a decreasing trend in BC mass concentrations over
India, at a rate of *242 ± 53 ng m
−3 year
−1 (Manoj et al.
2019). The negative trend in BC concentrations in the
backdrop of
rising BC emission trends (Sahu et al. 2008; Pandey et al.
2014) brings forth the uncertainty in BC estimates due to
scattered observations over the source region (IGP) (Rana
et al. 2019).
The trends in AOD over the Indian subcontinent have
also been reported from satellite observations. The annual
mean trend of AOD from MODIS observations for the
period 2000–2014 shows an increase of *40% over the
Indian landmass (Srivastava 2017). MODIS regional trends
show that the annual mean AODs have increased by >40%
in major urban cities like Jaipur, Hyderabad, and Bengaluru
during 2000–2009, while it has decreased (*10%) over
high-altitude sites of Dehradun and Shimla (Ramachandran
et al. 2012). Strong seasonal variability in AOD trends is
also observed from satellite observations. During winter
(DJF), a significantly increasing trend (1–2% year
−1 ,
0.02% year
−1 ) is observed over the subcontinent, especially
IGP (Srivastava 2017). SeaWiFS (Sea-Viewing Wide
Field-of-View Sensor) AOD shows an increasing trend of
0.0053 ± 0.0011 year
−1 during DJF over 1998–2010 (Hsu
et al. 2012). The post-monsoon/winter decadal trend from
Fig. 5.2 a Long-term 500 nm
AOD trends derived from
ARFINET station data. Different
colors and symbols differentiate
the stations and b long-term trend
in regional mean aerosol optical
depth at 500 nm. Adopted
from Krishna Moorthy et al.
(2013). © American Geophysical
Union. Used with permission
5 Atmospheric Aerosols and Trace Gases
97