

7.5 Student’s t-Distribution
83
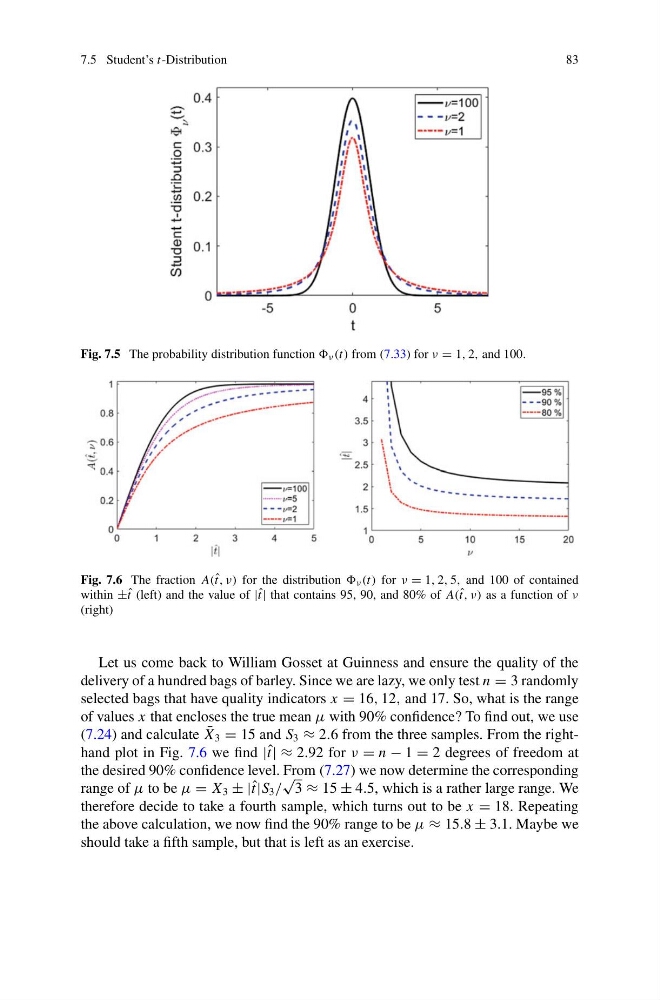
Fig. 7.5 The probability distribution function ν (t) from (7.33) for ν = 1, 2, and 100.
Fig. 7.6 The fraction A(ˆ t, ν) for the distribution ν (t) for ν = 1, 2, 5, and 100 of contained
within ±ˆ t (left) and the value of |ˆ t| that contains 95, 90, and 80% of A(ˆ t, ν) as a function of ν
(right)
Let us come back to William Gosset at Guinness and ensure the quality of the
delivery of a hundred bags of barley. Since we are lazy, we only test n = 3 randomly
selected bags that have quality indicators x = 16, 12, and 17. So, what is the range
of values x that encloses the true mean μ with 90% confidence? To find out, we use
(7.24) and calculate ¯
X 3 = 15 and S 3 ≈ 2.6 from the three samples. From the righthand plot in Fig. 7.6 we find |ˆ t| ≈ 2.92 for ν = n − 1 = 2 degrees of freedom at
the desired 90% confidence level. From (7.27) we now determine the corresponding
range of μ to be μ = X 3 ± |ˆ t|S 3 /
√
3 ≈ 15 ± 4.5, which is a rather large range. We
therefore decide to take a fourth sample, which turns out to be x = 18. Repeating
the above calculation, we now find the 90% range to be μ ≈ 15.8 ± 3.1. Maybe we
should take a fifth sample, but that is left as an exercise.
83
Fig. 7.5 The probability distribution function ν (t) from (7.33) for ν = 1, 2, and 100.
Fig. 7.6 The fraction A(ˆ t, ν) for the distribution ν (t) for ν = 1, 2, 5, and 100 of contained
within ±ˆ t (left) and the value of |ˆ t| that contains 95, 90, and 80% of A(ˆ t, ν) as a function of ν
(right)
Let us come back to William Gosset at Guinness and ensure the quality of the
delivery of a hundred bags of barley. Since we are lazy, we only test n = 3 randomly
selected bags that have quality indicators x = 16, 12, and 17. So, what is the range
of values x that encloses the true mean μ with 90% confidence? To find out, we use
(7.24) and calculate ¯
X 3 = 15 and S 3 ≈ 2.6 from the three samples. From the righthand plot in Fig. 7.6 we find |ˆ t| ≈ 2.92 for ν = n − 1 = 2 degrees of freedom at
the desired 90% confidence level. From (7.27) we now determine the corresponding
range of μ to be μ = X 3 ± |ˆ t|S 3 /
√
3 ≈ 15 ± 4.5, which is a rather large range. We
therefore decide to take a fourth sample, which turns out to be x = 18. Repeating
the above calculation, we now find the 90% range to be μ ≈ 15.8 ± 3.1. Maybe we
should take a fifth sample, but that is left as an exercise.