

6.1 The Greeks
61
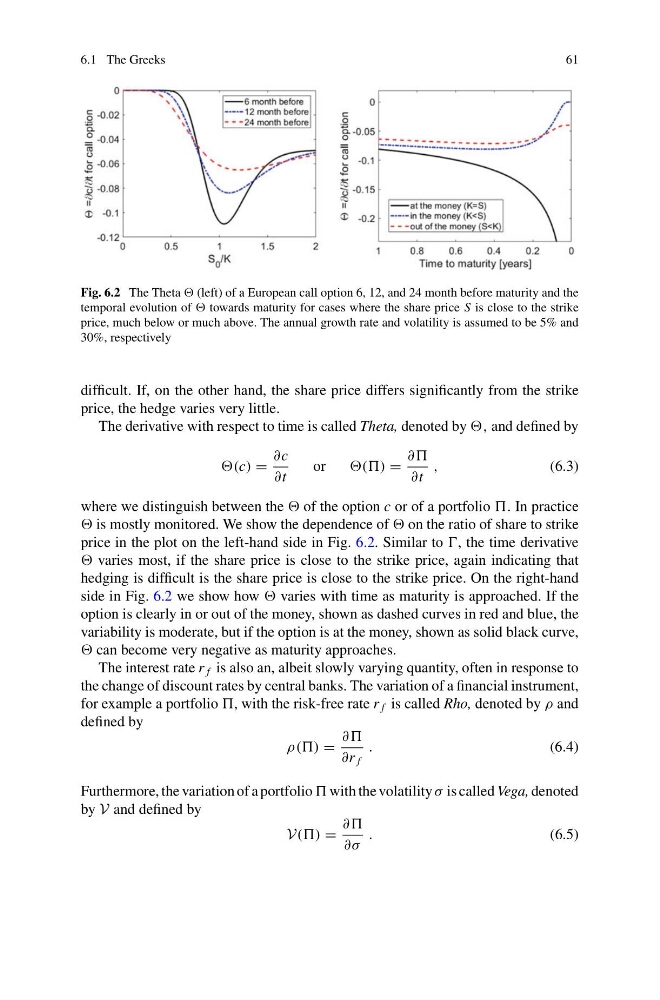
Fig. 6.2 The Theta (left) of a European call option 6, 12, and 24 month before maturity and the
temporal evolution of towards maturity for cases where the share price S is close to the strike
price, much below or much above. The annual growth rate and volatility is assumed to be 5% and
30%, respectively
difficult. If, on the other hand, the share price differs significantly from the strike
price, the hedge varies very little.
The derivative with respect to time is called Theta, denoted by , and defined by
(c) =
∂c
∂t
or
=
∂∂
∂t
,
(6.3)
where we distinguish between the of the option c or of a portfolio . In practice
is mostly monitored. We show the dependence of on the ratio of share to strike
price in the plot on the left-hand side in Fig. 6.2. Similar to , the time derivative
varies most, if the share price is close to the strike price, again indicating that
hedging is difficult is the share price is close to the strike price. On the right-hand
side in Fig. 6.2 we show how varies with time as maturity is approached. If the
option is clearly in or out of the money, shown as dashed curves in red and blue, the
variability is moderate, but if the option is at the money, shown as solid black curve,
can become very negative as maturity approaches.
The interest rate r f is also an, albeit slowly varying quantity, often in response to
the change of discount rates by central banks. The variation of a financial instrument,
for example a portfolio , with the risk-free rate r f is called Rho, denoted by ρ and
defined by
ρ(() =
∂∂
∂r f
.
(6.4)
Furthermore, the variation of a portfolio with the volatility σ is called Vega, denoted
by V and defined by
V(() =
∂∂
∂σ
.
(6.5)
61
Fig. 6.2 The Theta (left) of a European call option 6, 12, and 24 month before maturity and the
temporal evolution of towards maturity for cases where the share price S is close to the strike
price, much below or much above. The annual growth rate and volatility is assumed to be 5% and
30%, respectively
difficult. If, on the other hand, the share price differs significantly from the strike
price, the hedge varies very little.
The derivative with respect to time is called Theta, denoted by , and defined by
(c) =
∂c
∂t
or
=
∂∂
∂t
,
(6.3)
where we distinguish between the of the option c or of a portfolio . In practice
is mostly monitored. We show the dependence of on the ratio of share to strike
price in the plot on the left-hand side in Fig. 6.2. Similar to , the time derivative
varies most, if the share price is close to the strike price, again indicating that
hedging is difficult is the share price is close to the strike price. On the right-hand
side in Fig. 6.2 we show how varies with time as maturity is approached. If the
option is clearly in or out of the money, shown as dashed curves in red and blue, the
variability is moderate, but if the option is at the money, shown as solid black curve,
can become very negative as maturity approaches.
The interest rate r f is also an, albeit slowly varying quantity, often in response to
the change of discount rates by central banks. The variation of a financial instrument,
for example a portfolio , with the risk-free rate r f is called Rho, denoted by ρ and
defined by
ρ(() =
∂∂
∂r f
.
(6.4)
Furthermore, the variation of a portfolio with the volatility σ is called Vega, denoted
by V and defined by
V(() =
∂∂
∂σ
.
(6.5)