

3.5 Capital Asset Pricing Model
25
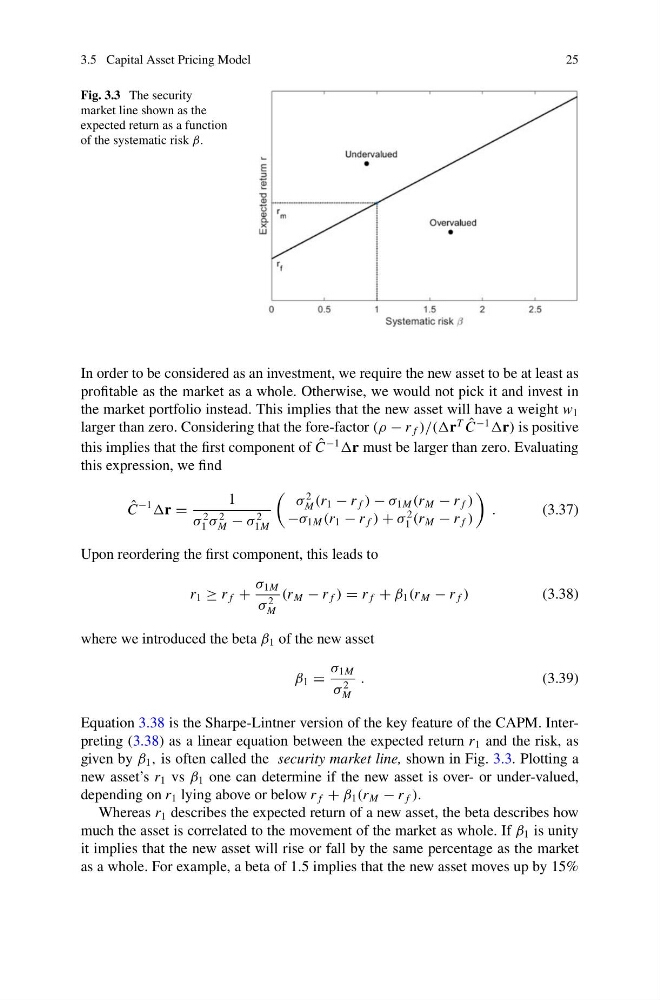
Fig. 3.3 The security
market line shown as the
expected return as a function
of the systematic risk β.
In order to be considered as an investment, we require the new asset to be at least as
profitable as the market as a whole. Otherwise, we would not pick it and invest in
the market portfolio instead. This implies that the new asset will have a weight w 1
larger than zero. Considering that the fore-factor (ρ − r f )/((r
T ˆ
C
−1
r) is positive
this implies that the first component of ˆ
C
−1
r must be larger than zero. Evaluating
this expression, we find
ˆ
C
−1
r =
1
σ
2
1 σ
2
M − σ
2
1M
σ
2
M (r 1 − r f ) − σ 1M (r M − r f )
−σ 1M (r 1 − r f ) + σ
2
1 (r M − r f )
.
(3.37)
Upon reordering the first component, this leads to
r 1 ≥ r f +
σ 1M
σ
2
M
(r M − r f ) = r f + β 1 (r M − r f )
(3.38)
where we introduced the beta β 1 of the new asset
β 1 =
σ 1M
σ
2
M
.
(3.39)
Equation 3.38 is the Sharpe-Lintner version of the key feature of the CAPM. Interpreting (3.38) as a linear equation between the expected return r 1 and the risk, as
given by β 1 , is often called the security market line, shown in Fig. 3.3. Plotting a
new asset’s r 1 vs β 1 one can determine if the new asset is over- or under-valued,
depending on r 1 lying above or below r f + β 1 (r M − r f ).
Whereas r 1 describes the expected return of a new asset, the beta describes how
much the asset is correlated to the movement of the market as whole. If β 1 is unity
it implies that the new asset will rise or fall by the same percentage as the market
as a whole. For example, a beta of 1.5 implies that the new asset moves up by 15%
25
Fig. 3.3 The security
market line shown as the
expected return as a function
of the systematic risk β.
In order to be considered as an investment, we require the new asset to be at least as
profitable as the market as a whole. Otherwise, we would not pick it and invest in
the market portfolio instead. This implies that the new asset will have a weight w 1
larger than zero. Considering that the fore-factor (ρ − r f )/((r
T ˆ
C
−1
r) is positive
this implies that the first component of ˆ
C
−1
r must be larger than zero. Evaluating
this expression, we find
ˆ
C
−1
r =
1
σ
2
1 σ
2
M − σ
2
1M
σ
2
M (r 1 − r f ) − σ 1M (r M − r f )
−σ 1M (r 1 − r f ) + σ
2
1 (r M − r f )
.
(3.37)
Upon reordering the first component, this leads to
r 1 ≥ r f +
σ 1M
σ
2
M
(r M − r f ) = r f + β 1 (r M − r f )
(3.38)
where we introduced the beta β 1 of the new asset
β 1 =
σ 1M
σ
2
M
.
(3.39)
Equation 3.38 is the Sharpe-Lintner version of the key feature of the CAPM. Interpreting (3.38) as a linear equation between the expected return r 1 and the risk, as
given by β 1 , is often called the security market line, shown in Fig. 3.3. Plotting a
new asset’s r 1 vs β 1 one can determine if the new asset is over- or under-valued,
depending on r 1 lying above or below r f + β 1 (r M − r f ).
Whereas r 1 describes the expected return of a new asset, the beta describes how
much the asset is correlated to the movement of the market as whole. If β 1 is unity
it implies that the new asset will rise or fall by the same percentage as the market
as a whole. For example, a beta of 1.5 implies that the new asset moves up by 15%