

9.6 Fractals
125
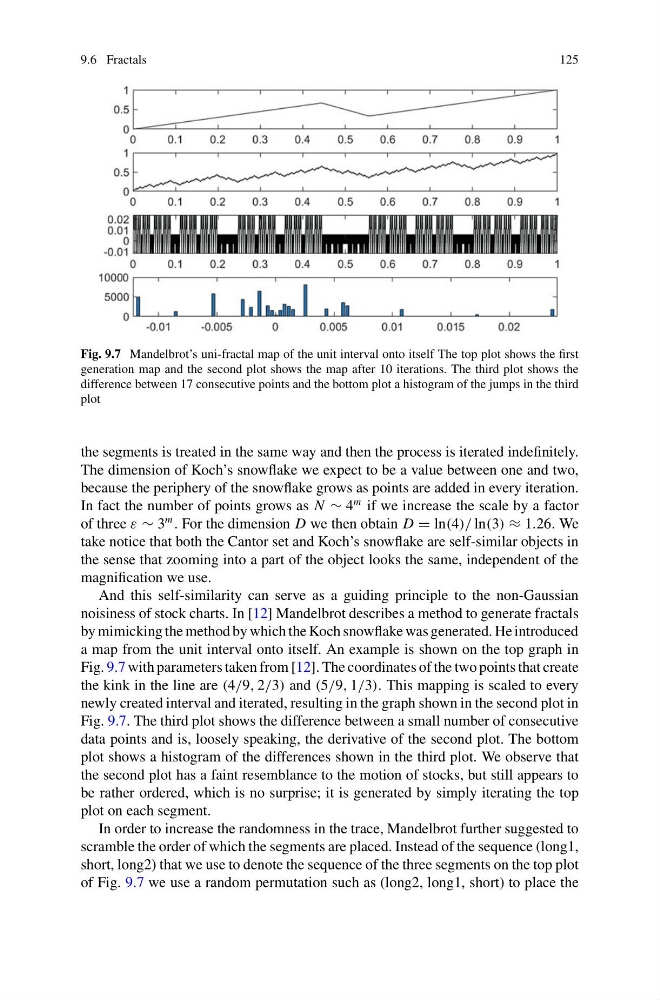
Fig. 9.7 Mandelbrot’s uni-fractal map of the unit interval onto itself The top plot shows the first
generation map and the second plot shows the map after 10 iterations. The third plot shows the
difference between 17 consecutive points and the bottom plot a histogram of the jumps in the third
plot
the segments is treated in the same way and then the process is iterated indefinitely.
The dimension of Koch’s snowflake we expect to be a value between one and two,
because the periphery of the snowflake grows as points are added in every iteration.
In fact the number of points grows as N ∼ 4
m if we increase the scale by a factor
of three ε ∼ 3
m
. For the dimension D we then obtain D = ln(4)/ ln(3) ≈ 1.26. We
take notice that both the Cantor set and Koch’s snowflake are self-similar objects in
the sense that zooming into a part of the object looks the same, independent of the
magnification we use.
And this self-similarity can serve as a guiding principle to the non-Gaussian
noisiness of stock charts. In [12] Mandelbrot describes a method to generate fractals
by mimicking the method by which the Koch snowflake was generated. He introduced
a map from the unit interval onto itself. An example is shown on the top graph in
Fig. 9.7 with parameters taken from [12]. The coordinates of the two points that create
the kink in the line are (4/9, 2/3) and (5/9, 1/3). This mapping is scaled to every
newly created interval and iterated, resulting in the graph shown in the second plot in
Fig. 9.7. The third plot shows the difference between a small number of consecutive
data points and is, loosely speaking, the derivative of the second plot. The bottom
plot shows a histogram of the differences shown in the third plot. We observe that
the second plot has a faint resemblance to the motion of stocks, but still appears to
be rather ordered, which is no surprise; it is generated by simply iterating the top
plot on each segment.
In order to increase the randomness in the trace, Mandelbrot further suggested to
scramble the order of which the segments are placed. Instead of the sequence (long1,
short, long2) that we use to denote the sequence of the three segments on the top plot
of Fig. 9.7 we use a random permutation such as (long2, long1, short) to place the
125
Fig. 9.7 Mandelbrot’s uni-fractal map of the unit interval onto itself The top plot shows the first
generation map and the second plot shows the map after 10 iterations. The third plot shows the
difference between 17 consecutive points and the bottom plot a histogram of the jumps in the third
plot
the segments is treated in the same way and then the process is iterated indefinitely.
The dimension of Koch’s snowflake we expect to be a value between one and two,
because the periphery of the snowflake grows as points are added in every iteration.
In fact the number of points grows as N ∼ 4
m if we increase the scale by a factor
of three ε ∼ 3
m
. For the dimension D we then obtain D = ln(4)/ ln(3) ≈ 1.26. We
take notice that both the Cantor set and Koch’s snowflake are self-similar objects in
the sense that zooming into a part of the object looks the same, independent of the
magnification we use.
And this self-similarity can serve as a guiding principle to the non-Gaussian
noisiness of stock charts. In [12] Mandelbrot describes a method to generate fractals
by mimicking the method by which the Koch snowflake was generated. He introduced
a map from the unit interval onto itself. An example is shown on the top graph in
Fig. 9.7 with parameters taken from [12]. The coordinates of the two points that create
the kink in the line are (4/9, 2/3) and (5/9, 1/3). This mapping is scaled to every
newly created interval and iterated, resulting in the graph shown in the second plot in
Fig. 9.7. The third plot shows the difference between a small number of consecutive
data points and is, loosely speaking, the derivative of the second plot. The bottom
plot shows a histogram of the differences shown in the third plot. We observe that
the second plot has a faint resemblance to the motion of stocks, but still appears to
be rather ordered, which is no surprise; it is generated by simply iterating the top
plot on each segment.
In order to increase the randomness in the trace, Mandelbrot further suggested to
scramble the order of which the segments are placed. Instead of the sequence (long1,
short, long2) that we use to denote the sequence of the three segments on the top plot
of Fig. 9.7 we use a random permutation such as (long2, long1, short) to place the