

9.3 Behavioral Economics
119
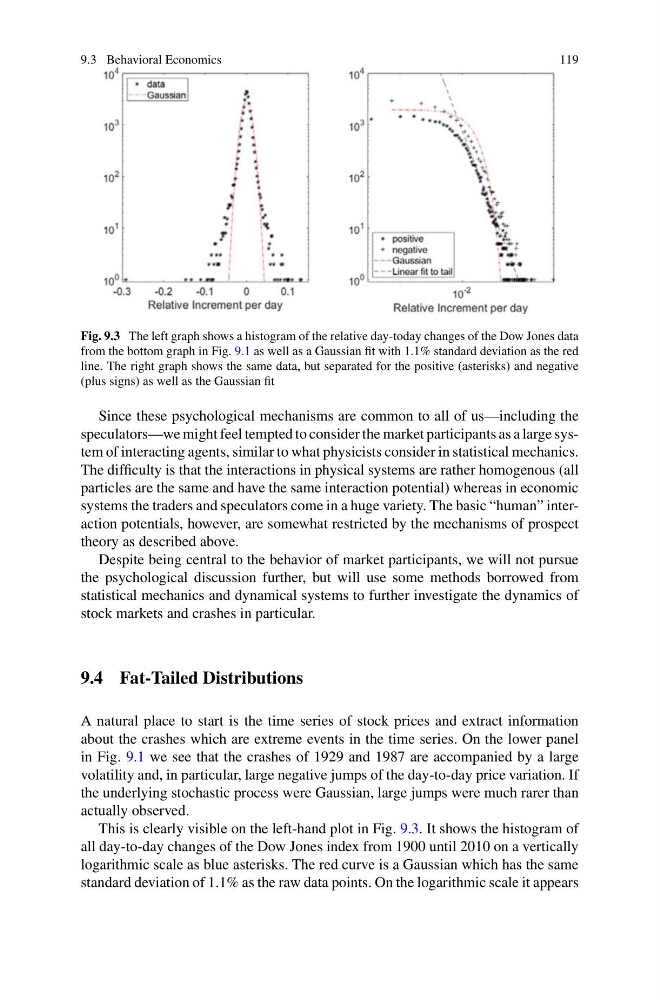
Fig. 9.3 The left graph shows a histogram of the relative day-today changes of the Dow Jones data
from the bottom graph in Fig. 9.1 as well as a Gaussian fit with 1.1% standard deviation as the red
line. The right graph shows the same data, but separated for the positive (asterisks) and negative
(plus signs) as well as the Gaussian fit
Since these psychological mechanisms are common to all of us—including the
speculators—we might feel tempted to consider the market participants as a large system of interacting agents, similar to what physicists consider in statistical mechanics.
The difficulty is that the interactions in physical systems are rather homogenous (all
particles are the same and have the same interaction potential) whereas in economic
systems the traders and speculators come in a huge variety. The basic “human” interaction potentials, however, are somewhat restricted by the mechanisms of prospect
theory as described above.
Despite being central to the behavior of market participants, we will not pursue
the psychological discussion further, but will use some methods borrowed from
statistical mechanics and dynamical systems to further investigate the dynamics of
stock markets and crashes in particular.
9.4 Fat-Tailed Distributions
A natural place to start is the time series of stock prices and extract information
about the crashes which are extreme events in the time series. On the lower panel
in Fig. 9.1 we see that the crashes of 1929 and 1987 are accompanied by a large
volatility and, in particular, large negative jumps of the day-to-day price variation. If
the underlying stochastic process were Gaussian, large jumps were much rarer than
actually observed.
This is clearly visible on the left-hand plot in Fig. 9.3. It shows the histogram of
all day-to-day changes of the Dow Jones index from 1900 until 2010 on a vertically
logarithmic scale as blue asterisks. The red curve is a Gaussian which has the same
standard deviation of 1.1% as the raw data points. On the logarithmic scale it appears
119
Fig. 9.3 The left graph shows a histogram of the relative day-today changes of the Dow Jones data
from the bottom graph in Fig. 9.1 as well as a Gaussian fit with 1.1% standard deviation as the red
line. The right graph shows the same data, but separated for the positive (asterisks) and negative
(plus signs) as well as the Gaussian fit
Since these psychological mechanisms are common to all of us—including the
speculators—we might feel tempted to consider the market participants as a large system of interacting agents, similar to what physicists consider in statistical mechanics.
The difficulty is that the interactions in physical systems are rather homogenous (all
particles are the same and have the same interaction potential) whereas in economic
systems the traders and speculators come in a huge variety. The basic “human” interaction potentials, however, are somewhat restricted by the mechanisms of prospect
theory as described above.
Despite being central to the behavior of market participants, we will not pursue
the psychological discussion further, but will use some methods borrowed from
statistical mechanics and dynamical systems to further investigate the dynamics of
stock markets and crashes in particular.
9.4 Fat-Tailed Distributions
A natural place to start is the time series of stock prices and extract information
about the crashes which are extreme events in the time series. On the lower panel
in Fig. 9.1 we see that the crashes of 1929 and 1987 are accompanied by a large
volatility and, in particular, large negative jumps of the day-to-day price variation. If
the underlying stochastic process were Gaussian, large jumps were much rarer than
actually observed.
This is clearly visible on the left-hand plot in Fig. 9.3. It shows the histogram of
all day-to-day changes of the Dow Jones index from 1900 until 2010 on a vertically
logarithmic scale as blue asterisks. The red curve is a Gaussian which has the same
standard deviation of 1.1% as the raw data points. On the logarithmic scale it appears