

330
S. Capolongo et al.
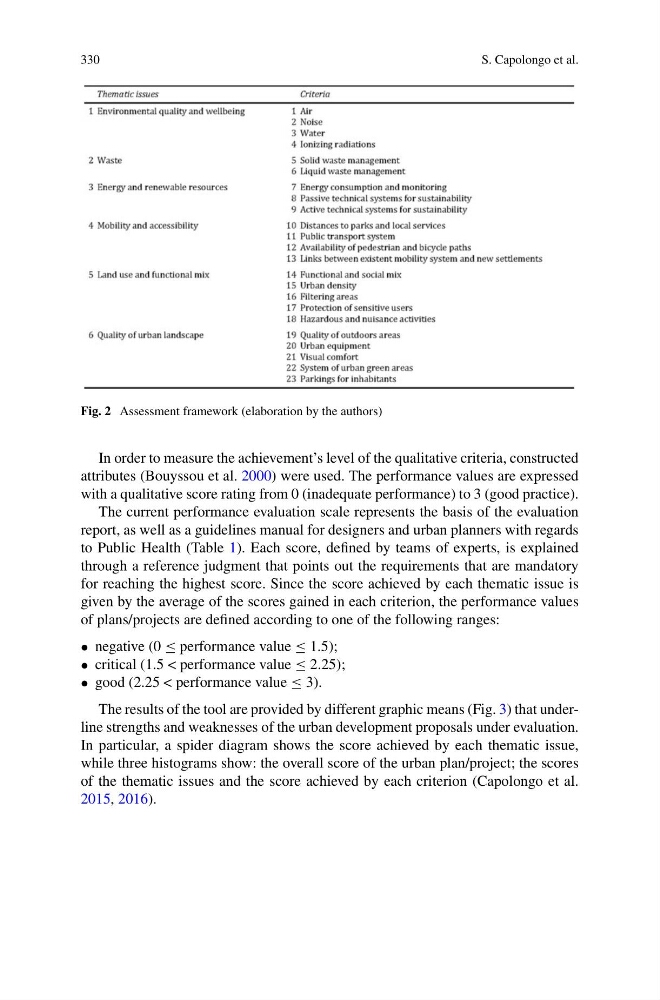
Fig. 2 Assessment framework (elaboration by the authors)
In order to measure the achievement’s level of the qualitative criteria, constructed
attributes (Bouyssou et al. 2000) were used. The performance values are expressed
with a qualitative score rating from 0 (inadequate performance) to 3 (good practice).
The current performance evaluation scale represents the basis of the evaluation
report, as well as a guidelines manual for designers and urban planners with regards
to Public Health (Table 1). Each score, defined by teams of experts, is explained
through a reference judgment that points out the requirements that are mandatory
for reaching the highest score. Since the score achieved by each thematic issue is
given by the average of the scores gained in each criterion, the performance values
of plans/projects are defined according to one of the following ranges:
• negative (0 ≤ performance value ≤ 1.5);
• critical (1.5 < performance value ≤ 2.25);
• good (2.25 < performance value ≤ 3).
The results of the tool are provided by different graphic means (Fig. 3) that underline strengths and weaknesses of the urban development proposals under evaluation.
In particular, a spider diagram shows the score achieved by each thematic issue,
while three histograms show: the overall score of the urban plan/project; the scores
of the thematic issues and the score achieved by each criterion (Capolongo et al.
2015, 2016).
S. Capolongo et al.
Fig. 2 Assessment framework (elaboration by the authors)
In order to measure the achievement’s level of the qualitative criteria, constructed
attributes (Bouyssou et al. 2000) were used. The performance values are expressed
with a qualitative score rating from 0 (inadequate performance) to 3 (good practice).
The current performance evaluation scale represents the basis of the evaluation
report, as well as a guidelines manual for designers and urban planners with regards
to Public Health (Table 1). Each score, defined by teams of experts, is explained
through a reference judgment that points out the requirements that are mandatory
for reaching the highest score. Since the score achieved by each thematic issue is
given by the average of the scores gained in each criterion, the performance values
of plans/projects are defined according to one of the following ranges:
• negative (0 ≤ performance value ≤ 1.5);
• critical (1.5 < performance value ≤ 2.25);
• good (2.25 < performance value ≤ 3).
The results of the tool are provided by different graphic means (Fig. 3) that underline strengths and weaknesses of the urban development proposals under evaluation.
In particular, a spider diagram shows the score achieved by each thematic issue,
while three histograms show: the overall score of the urban plan/project; the scores
of the thematic issues and the score achieved by each criterion (Capolongo et al.
2015, 2016).