

82
4 Motion of Microorganisms
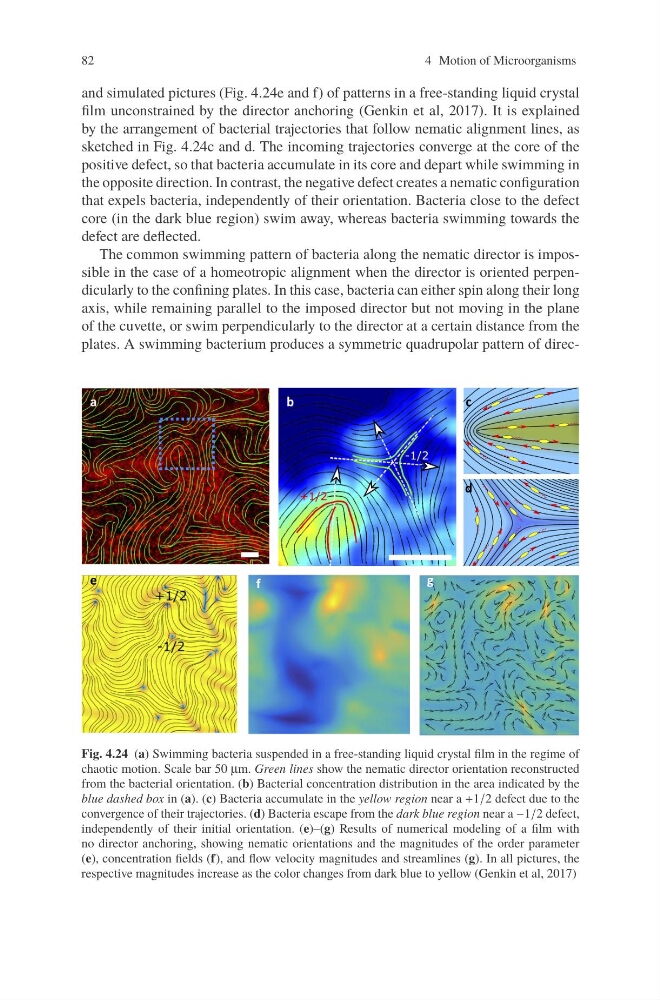
and simulated pictures (Fig. 4.24e and f) of patterns in a free-standing liquid crystal
film unconstrained by the director anchoring (Genkin et al, 2017). It is explained
by the arrangement of bacterial trajectories that follow nematic alignment lines, as
sketched in Fig. 4.24c and d. The incoming trajectories converge at the core of the
positive defect, so that bacteria accumulate in its core and depart while swimming in
the opposite direction. In contrast, the negative defect creates a nematic configuration
that expels bacteria, independently of their orientation. Bacteria close to the defect
core (in the dark blue region) swim away, whereas bacteria swimming towards the
defect are deflected.
The common swimming pattern of bacteria along the nematic director is impossible in the case of a homeotropic alignment when the director is oriented perpendicularly to the confining plates. In this case, bacteria can either spin along their long
axis, while remaining parallel to the imposed director but not moving in the plane
of the cuvette, or swim perpendicularly to the director at a certain distance from the
plates. A swimming bacterium produces a symmetric quadrupolar pattern of direcFig. 4.24 (a) Swimming bacteria suspended in a free-standing liquid crystal film in the regime of
chaotic motion. Scale bar 50 μm. Green lines show the nematic director orientation reconstructed
from the bacterial orientation. (b) Bacterial concentration distribution in the area indicated by the
blue dashed box in (a). (c) Bacteria accumulate in the yellow region near a +1/2 defect due to the
convergence of their trajectories. (d) Bacteria escape from the dark blue region near a −1/2 defect,
independently of their initial orientation. (e)–(g) Results of numerical modeling of a film with
no director anchoring, showing nematic orientations and the magnitudes of the order parameter
(e), concentration fields (f), and flow velocity magnitudes and streamlines (g). In all pictures, the
respective magnitudes increase as the color changes from dark blue to yellow (Genkin et al, 2017)
4 Motion of Microorganisms
and simulated pictures (Fig. 4.24e and f) of patterns in a free-standing liquid crystal
film unconstrained by the director anchoring (Genkin et al, 2017). It is explained
by the arrangement of bacterial trajectories that follow nematic alignment lines, as
sketched in Fig. 4.24c and d. The incoming trajectories converge at the core of the
positive defect, so that bacteria accumulate in its core and depart while swimming in
the opposite direction. In contrast, the negative defect creates a nematic configuration
that expels bacteria, independently of their orientation. Bacteria close to the defect
core (in the dark blue region) swim away, whereas bacteria swimming towards the
defect are deflected.
The common swimming pattern of bacteria along the nematic director is impossible in the case of a homeotropic alignment when the director is oriented perpendicularly to the confining plates. In this case, bacteria can either spin along their long
axis, while remaining parallel to the imposed director but not moving in the plane
of the cuvette, or swim perpendicularly to the director at a certain distance from the
plates. A swimming bacterium produces a symmetric quadrupolar pattern of direcFig. 4.24 (a) Swimming bacteria suspended in a free-standing liquid crystal film in the regime of
chaotic motion. Scale bar 50 μm. Green lines show the nematic director orientation reconstructed
from the bacterial orientation. (b) Bacterial concentration distribution in the area indicated by the
blue dashed box in (a). (c) Bacteria accumulate in the yellow region near a +1/2 defect due to the
convergence of their trajectories. (d) Bacteria escape from the dark blue region near a −1/2 defect,
independently of their initial orientation. (e)–(g) Results of numerical modeling of a film with
no director anchoring, showing nematic orientations and the magnitudes of the order parameter
(e), concentration fields (f), and flow velocity magnitudes and streamlines (g). In all pictures, the
respective magnitudes increase as the color changes from dark blue to yellow (Genkin et al, 2017)