

62
3 Active Colloids
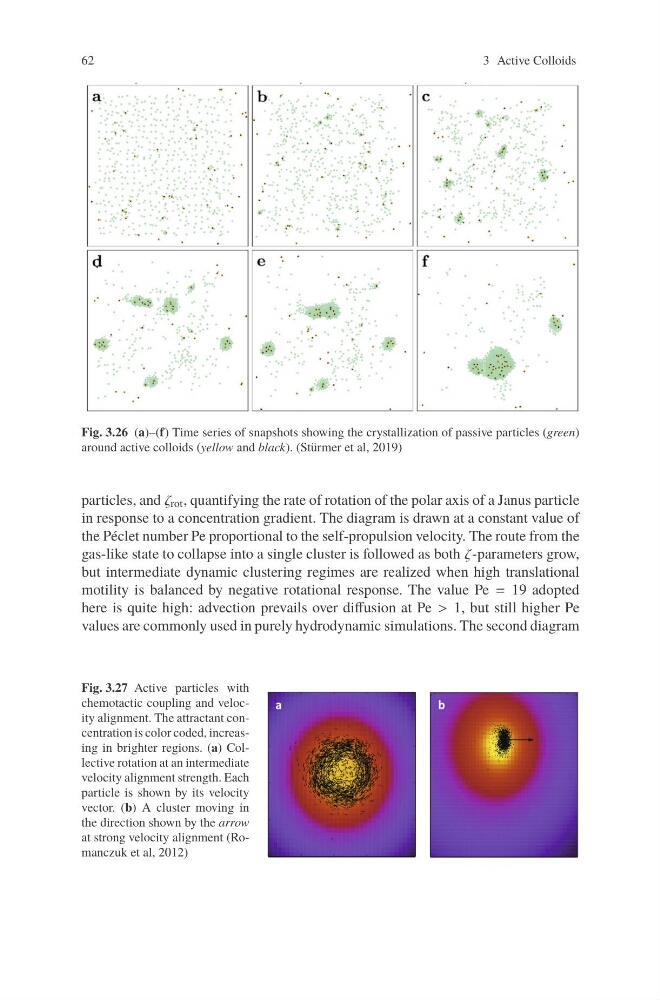
Fig. 3.26 (a)–(f) Time series of snapshots showing the crystallization of passive particles (green)
around active colloids (yellow and black). (Stürmer et al, 2019)
particles, and ζ rot , quantifying the rate of rotation of the polar axis of a Janus particle
in response to a concentration gradient. The diagram is drawn at a constant value of
the Péclet number Pe proportional to the self-propulsion velocity. The route from the
gas-like state to collapse into a single cluster is followed as both ζ-parameters grow,
but intermediate dynamic clustering regimes are realized when high translational
motility is balanced by negative rotational response. The value Pe = 19 adopted
here is quite high: advection prevails over diffusion at Pe > 1, but still higher Pe
values are commonly used in purely hydrodynamic simulations. The second diagram
Fig. 3.27 Active particles with
chemotactic coupling and velocity alignment. The attractant concentration is color coded, increasing in brighter regions. (a) Collective rotation at an intermediate
velocity alignment strength. Each
particle is shown by its velocity
vector. (b) A cluster moving in
the direction shown by the arrow
at strong velocity alignment (Romanczuk et al, 2012)
3 Active Colloids
Fig. 3.26 (a)–(f) Time series of snapshots showing the crystallization of passive particles (green)
around active colloids (yellow and black). (Stürmer et al, 2019)
particles, and ζ rot , quantifying the rate of rotation of the polar axis of a Janus particle
in response to a concentration gradient. The diagram is drawn at a constant value of
the Péclet number Pe proportional to the self-propulsion velocity. The route from the
gas-like state to collapse into a single cluster is followed as both ζ-parameters grow,
but intermediate dynamic clustering regimes are realized when high translational
motility is balanced by negative rotational response. The value Pe = 19 adopted
here is quite high: advection prevails over diffusion at Pe > 1, but still higher Pe
values are commonly used in purely hydrodynamic simulations. The second diagram
Fig. 3.27 Active particles with
chemotactic coupling and velocity alignment. The attractant concentration is color coded, increasing in brighter regions. (a) Collective rotation at an intermediate
velocity alignment strength. Each
particle is shown by its velocity
vector. (b) A cluster moving in
the direction shown by the arrow
at strong velocity alignment (Romanczuk et al, 2012)