

136
6 Active Gels
The closest analogy to living tissues becomes apparent when deformations are
caused by chemical interactions. The nematic–isotropic transition may be shifted
by changing the concentration of the mesogenic component. This can be done by
adding a non-mesogenic dopant or through isomerization induced by illumination or
chemical agents. A more subtle effect is interaction of gradients of the concentration
of a non-mesogenic component and nematic orientation that can be accounted for
by adding the relevant term to the energy density (2.1) or, more appropriately, to
the more precise expression based on the nematic tensor (2.2). The energy may be
minimized by separating the nematic and isotropic phases. Depending on the sign
of the gradient interaction term, either parallel or normal nematic orientation can be
favored on the interphase boundary (Köpf and Pismen, 2013c).
Fig. 6.26 A flat sheet deformed to a semblance of
a human face (Griniasty et al, 2019)
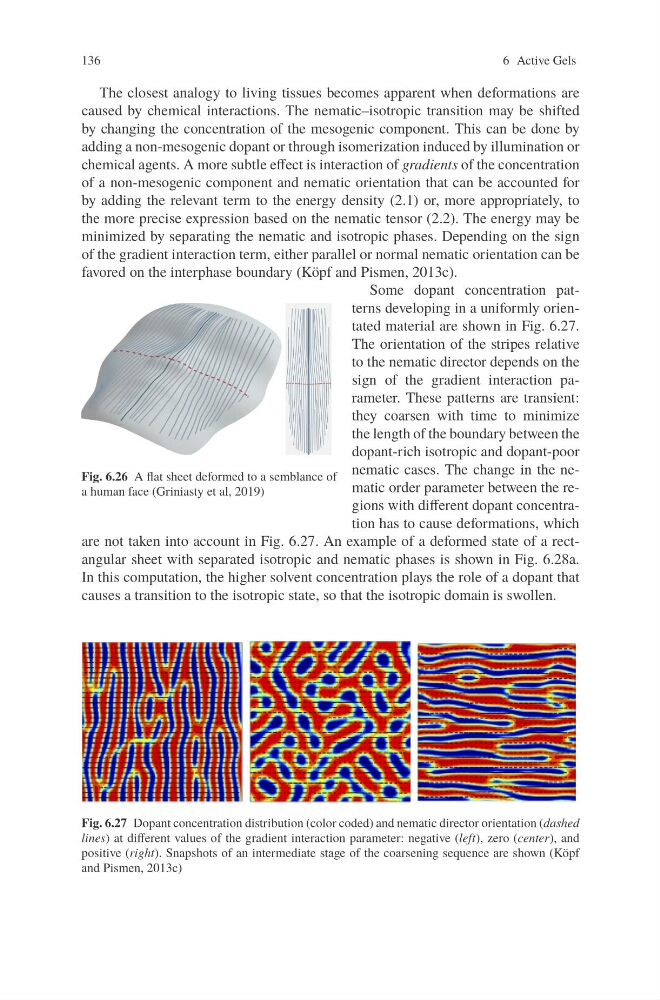
Some dopant concentration patterns developing in a uniformly orientated material are shown in Fig. 6.27.
The orientation of the stripes relative
to the nematic director depends on the
sign of the gradient interaction parameter. These patterns are transient:
they coarsen with time to minimize
the length of the boundary between the
dopant-rich isotropic and dopant-poor
nematic cases. The change in the nematic order parameter between the regions with different dopant concentration has to cause deformations, which
are not taken into account in Fig. 6.27. An example of a deformed state of a rectangular sheet with separated isotropic and nematic phases is shown in Fig. 6.28a.
In this computation, the higher solvent concentration plays the role of a dopant that
causes a transition to the isotropic state, so that the isotropic domain is swollen.
Fig. 6.27 Dopant concentration distribution (color coded) and nematic director orientation (dashed
lines) at different values of the gradient interaction parameter: negative (left), zero (center), and
positive (right). Snapshots of an intermediate stage of the coarsening sequence are shown (Köpf
and Pismen, 2013c)
6 Active Gels
The closest analogy to living tissues becomes apparent when deformations are
caused by chemical interactions. The nematic–isotropic transition may be shifted
by changing the concentration of the mesogenic component. This can be done by
adding a non-mesogenic dopant or through isomerization induced by illumination or
chemical agents. A more subtle effect is interaction of gradients of the concentration
of a non-mesogenic component and nematic orientation that can be accounted for
by adding the relevant term to the energy density (2.1) or, more appropriately, to
the more precise expression based on the nematic tensor (2.2). The energy may be
minimized by separating the nematic and isotropic phases. Depending on the sign
of the gradient interaction term, either parallel or normal nematic orientation can be
favored on the interphase boundary (Köpf and Pismen, 2013c).
Fig. 6.26 A flat sheet deformed to a semblance of
a human face (Griniasty et al, 2019)
Some dopant concentration patterns developing in a uniformly orientated material are shown in Fig. 6.27.
The orientation of the stripes relative
to the nematic director depends on the
sign of the gradient interaction parameter. These patterns are transient:
they coarsen with time to minimize
the length of the boundary between the
dopant-rich isotropic and dopant-poor
nematic cases. The change in the nematic order parameter between the regions with different dopant concentration has to cause deformations, which
are not taken into account in Fig. 6.27. An example of a deformed state of a rectangular sheet with separated isotropic and nematic phases is shown in Fig. 6.28a.
In this computation, the higher solvent concentration plays the role of a dopant that
causes a transition to the isotropic state, so that the isotropic domain is swollen.
Fig. 6.27 Dopant concentration distribution (color coded) and nematic director orientation (dashed
lines) at different values of the gradient interaction parameter: negative (left), zero (center), and
positive (right). Snapshots of an intermediate stage of the coarsening sequence are shown (Köpf
and Pismen, 2013c)