

6.4 Chemo-Elastic Instabilities
125
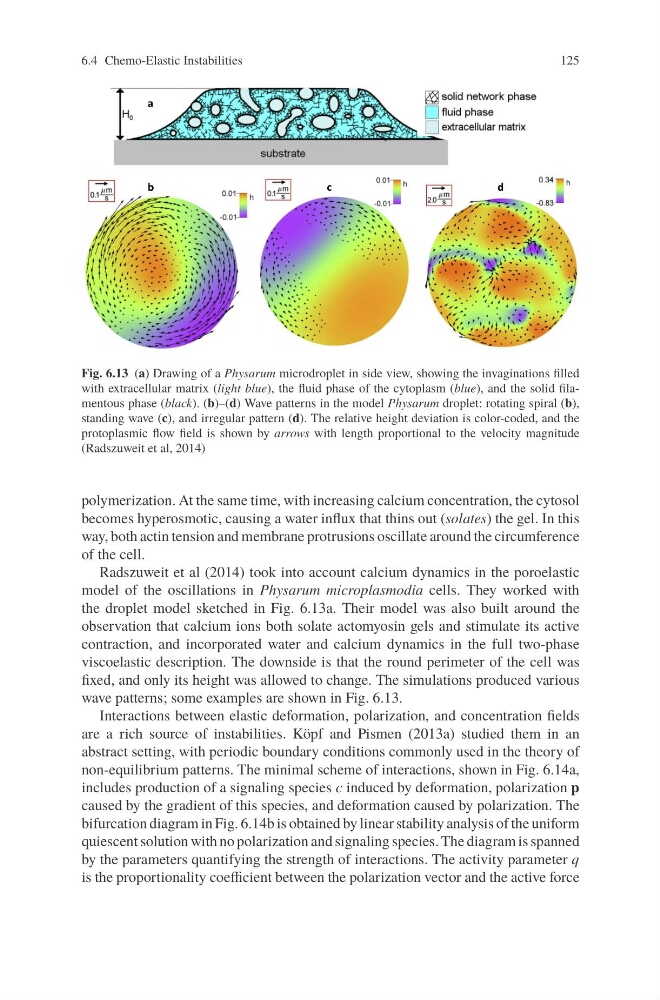
Fig. 6.13 (a) Drawing of a Physarum microdroplet in side view, showing the invaginations filled
with extracellular matrix (light blue), the fluid phase of the cytoplasm (blue), and the solid filamentous phase (black). (b)–(d) Wave patterns in the model Physarum droplet: rotating spiral (b),
standing wave (c), and irregular pattern (d). The relative height deviation is color-coded, and the
protoplasmic flow field is shown by arrows with length proportional to the velocity magnitude
(Radszuweit et al, 2014)
polymerization. At the same time, with increasing calcium concentration, the cytosol
becomes hyperosmotic, causing a water influx that thins out (solates) the gel. In this
way, both actin tension and membrane protrusions oscillate around the circumference
of the cell.
Radszuweit et al (2014) took into account calcium dynamics in the poroelastic
model of the oscillations in Physarum microplasmodia cells. They worked with
the droplet model sketched in Fig. 6.13a. Their model was also built around the
observation that calcium ions both solate actomyosin gels and stimulate its active
contraction, and incorporated water and calcium dynamics in the full two-phase
viscoelastic description. The downside is that the round perimeter of the cell was
fixed, and only its height was allowed to change. The simulations produced various
wave patterns; some examples are shown in Fig. 6.13.
Interactions between elastic deformation, polarization, and concentration fields
are a rich source of instabilities. Köpf and Pismen (2013a) studied them in an
abstract setting, with periodic boundary conditions commonly used in the theory of
non-equilibrium patterns. The minimal scheme of interactions, shown in Fig. 6.14a,
includes production of a signaling species c induced by deformation, polarization p
caused by the gradient of this species, and deformation caused by polarization. The
bifurcation diagram in Fig. 6.14b is obtained by linear stability analysis of the uniform
quiescent solution with no polarization and signaling species. The diagram is spanned
by the parameters quantifying the strength of interactions. The activity parameter q
is the proportionality coefficient between the polarization vector and the active force
125
Fig. 6.13 (a) Drawing of a Physarum microdroplet in side view, showing the invaginations filled
with extracellular matrix (light blue), the fluid phase of the cytoplasm (blue), and the solid filamentous phase (black). (b)–(d) Wave patterns in the model Physarum droplet: rotating spiral (b),
standing wave (c), and irregular pattern (d). The relative height deviation is color-coded, and the
protoplasmic flow field is shown by arrows with length proportional to the velocity magnitude
(Radszuweit et al, 2014)
polymerization. At the same time, with increasing calcium concentration, the cytosol
becomes hyperosmotic, causing a water influx that thins out (solates) the gel. In this
way, both actin tension and membrane protrusions oscillate around the circumference
of the cell.
Radszuweit et al (2014) took into account calcium dynamics in the poroelastic
model of the oscillations in Physarum microplasmodia cells. They worked with
the droplet model sketched in Fig. 6.13a. Their model was also built around the
observation that calcium ions both solate actomyosin gels and stimulate its active
contraction, and incorporated water and calcium dynamics in the full two-phase
viscoelastic description. The downside is that the round perimeter of the cell was
fixed, and only its height was allowed to change. The simulations produced various
wave patterns; some examples are shown in Fig. 6.13.
Interactions between elastic deformation, polarization, and concentration fields
are a rich source of instabilities. Köpf and Pismen (2013a) studied them in an
abstract setting, with periodic boundary conditions commonly used in the theory of
non-equilibrium patterns. The minimal scheme of interactions, shown in Fig. 6.14a,
includes production of a signaling species c induced by deformation, polarization p
caused by the gradient of this species, and deformation caused by polarization. The
bifurcation diagram in Fig. 6.14b is obtained by linear stability analysis of the uniform
quiescent solution with no polarization and signaling species. The diagram is spanned
by the parameters quantifying the strength of interactions. The activity parameter q
is the proportionality coefficient between the polarization vector and the active force