

110
5 Eukaryotic Cells
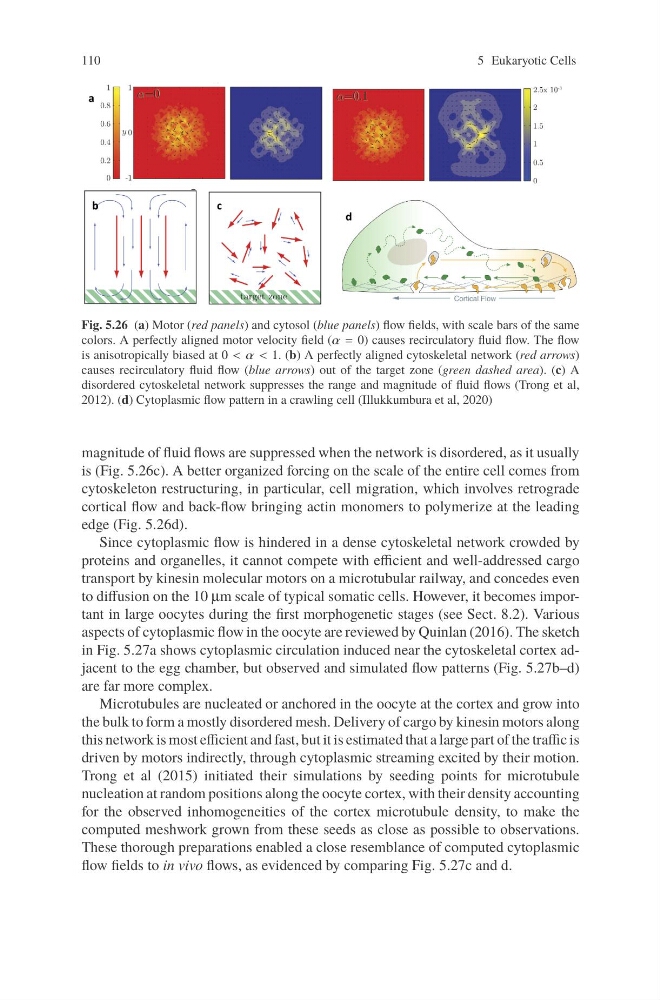
Fig. 5.26 (a) Motor (red panels) and cytosol (blue panels) flow fields, with scale bars of the same
colors. A perfectly aligned motor velocity field (α = 0) causes recirculatory fluid flow. The flow
is anisotropically biased at 0 < α < 1. (b) A perfectly aligned cytoskeletal network (red arrows)
causes recirculatory fluid flow (blue arrows) out of the target zone (green dashed area). (c) A
disordered cytoskeletal network suppresses the range and magnitude of fluid flows (Trong et al,
2012). (d) Cytoplasmic flow pattern in a crawling cell (Illukkumbura et al, 2020)
magnitude of fluid flows are suppressed when the network is disordered, as it usually
is (Fig. 5.26c). A better organized forcing on the scale of the entire cell comes from
cytoskeleton restructuring, in particular, cell migration, which involves retrograde
cortical flow and back-flow bringing actin monomers to polymerize at the leading
edge (Fig. 5.26d).
Since cytoplasmic flow is hindered in a dense cytoskeletal network crowded by
proteins and organelles, it cannot compete with efficient and well-addressed cargo
transport by kinesin molecular motors on a microtubular railway, and concedes even
to diffusion on the 10 μm scale of typical somatic cells. However, it becomes important in large oocytes during the first morphogenetic stages (see Sect. 8.2). Various
aspects of cytoplasmic flow in the oocyte are reviewed by Quinlan (2016). The sketch
in Fig. 5.27a shows cytoplasmic circulation induced near the cytoskeletal cortex adjacent to the egg chamber, but observed and simulated flow patterns (Fig. 5.27b–d)
are far more complex.
Microtubules are nucleated or anchored in the oocyte at the cortex and grow into
the bulk to form a mostly disordered mesh. Delivery of cargo by kinesin motors along
this network is most efficient and fast, but it is estimated that a large part of the traffic is
driven by motors indirectly, through cytoplasmic streaming excited by their motion.
Trong et al (2015) initiated their simulations by seeding points for microtubule
nucleation at random positions along the oocyte cortex, with their density accounting
for the observed inhomogeneities of the cortex microtubule density, to make the
computed meshwork grown from these seeds as close as possible to observations.
These thorough preparations enabled a close resemblance of computed cytoplasmic
flow fields to in vivo flows, as evidenced by comparing Fig. 5.27c and d.
5 Eukaryotic Cells
Fig. 5.26 (a) Motor (red panels) and cytosol (blue panels) flow fields, with scale bars of the same
colors. A perfectly aligned motor velocity field (α = 0) causes recirculatory fluid flow. The flow
is anisotropically biased at 0 < α < 1. (b) A perfectly aligned cytoskeletal network (red arrows)
causes recirculatory fluid flow (blue arrows) out of the target zone (green dashed area). (c) A
disordered cytoskeletal network suppresses the range and magnitude of fluid flows (Trong et al,
2012). (d) Cytoplasmic flow pattern in a crawling cell (Illukkumbura et al, 2020)
magnitude of fluid flows are suppressed when the network is disordered, as it usually
is (Fig. 5.26c). A better organized forcing on the scale of the entire cell comes from
cytoskeleton restructuring, in particular, cell migration, which involves retrograde
cortical flow and back-flow bringing actin monomers to polymerize at the leading
edge (Fig. 5.26d).
Since cytoplasmic flow is hindered in a dense cytoskeletal network crowded by
proteins and organelles, it cannot compete with efficient and well-addressed cargo
transport by kinesin molecular motors on a microtubular railway, and concedes even
to diffusion on the 10 μm scale of typical somatic cells. However, it becomes important in large oocytes during the first morphogenetic stages (see Sect. 8.2). Various
aspects of cytoplasmic flow in the oocyte are reviewed by Quinlan (2016). The sketch
in Fig. 5.27a shows cytoplasmic circulation induced near the cytoskeletal cortex adjacent to the egg chamber, but observed and simulated flow patterns (Fig. 5.27b–d)
are far more complex.
Microtubules are nucleated or anchored in the oocyte at the cortex and grow into
the bulk to form a mostly disordered mesh. Delivery of cargo by kinesin motors along
this network is most efficient and fast, but it is estimated that a large part of the traffic is
driven by motors indirectly, through cytoplasmic streaming excited by their motion.
Trong et al (2015) initiated their simulations by seeding points for microtubule
nucleation at random positions along the oocyte cortex, with their density accounting
for the observed inhomogeneities of the cortex microtubule density, to make the
computed meshwork grown from these seeds as close as possible to observations.
These thorough preparations enabled a close resemblance of computed cytoplasmic
flow fields to in vivo flows, as evidenced by comparing Fig. 5.27c and d.