

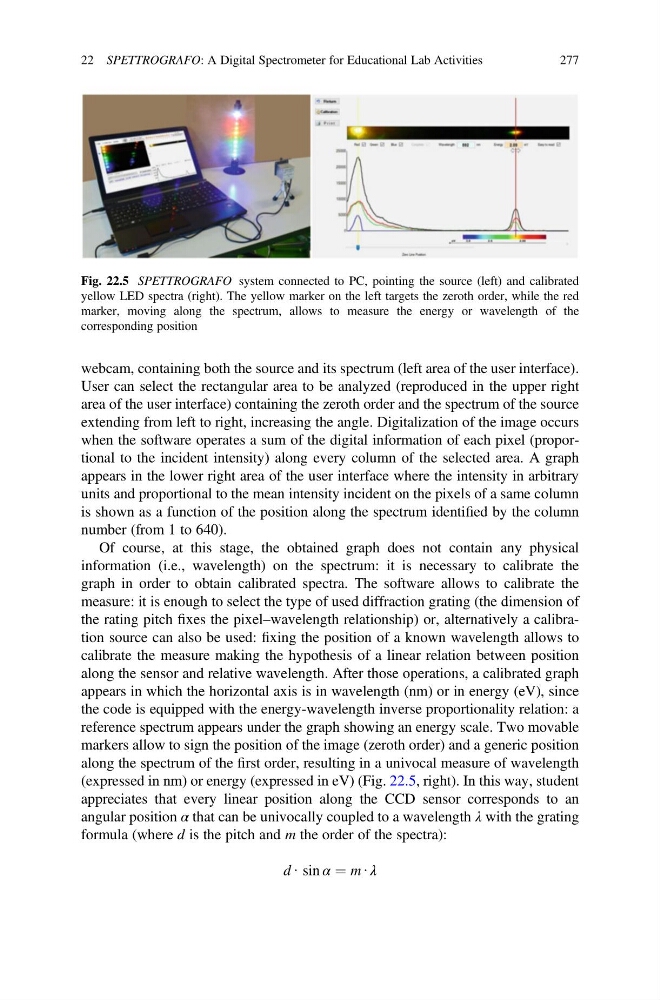
webcam, containing both the source and its spectrum (left area of the user interface).
User can select the rectangular area to be analyzed (reproduced in the upper right
area of the user interface) containing the zeroth order and the spectrum of the source
extending from left to right, increasing the angle. Digitalization of the image occurs
when the software operates a sum of the digital information of each pixel (proportional to the incident intensity) along every column of the selected area. A graph
appears in the lower right area of the user interface where the intensity in arbitrary
units and proportional to the mean intensity incident on the pixels of a same column
is shown as a function of the position along the spectrum identified by the column
number (from 1 to 640).
Of course, at this stage, the obtained graph does not contain any physical
information (i.e., wavelength) on the spectrum: it is necessary to calibrate the
graph in order to obtain calibrated spectra. The software allows to calibrate the
measure: it is enough to select the type of used diffraction grating (the dimension of
the rating pitch fixes the pixel–wavelength relationship) or, alternatively a calibration source can also be used: fixing the position of a known wavelength allows to
calibrate the measure making the hypothesis of a linear relation between position
along the sensor and relative wavelength. After those operations, a calibrated graph
appears in which the horizontal axis is in wavelength (nm) or in energy (eV), since
the code is equipped with the energy-wavelength inverse proportionality relation: a
reference spectrum appears under the graph showing an energy scale. Two movable
markers allow to sign the position of the image (zeroth order) and a generic position
along the spectrum of the first order, resulting in a univocal measure of wavelength
(expressed in nm) or energy (expressed in eV) (Fig. 22.5, right). In this way, student
appreciates that every linear position along the CCD sensor corresponds to an
angular position α that can be univocally coupled to a wavelength λ with the grating
formula (where d is the pitch and m the order of the spectra):
d ∙ sin α ¼ m ∙ λ
Fig. 22.5 SPETTROGRAFO system connected to PC, pointing the source (left) and calibrated
yellow LED spectra (right). The yellow marker on the left targets the zeroth order, while the red
marker, moving along the spectrum, allows to measure the energy or wavelength of the
corresponding position
22 SPETTROGRAFO: A Digital Spectrometer for Educational Lab Activities
277
User can select the rectangular area to be analyzed (reproduced in the upper right
area of the user interface) containing the zeroth order and the spectrum of the source
extending from left to right, increasing the angle. Digitalization of the image occurs
when the software operates a sum of the digital information of each pixel (proportional to the incident intensity) along every column of the selected area. A graph
appears in the lower right area of the user interface where the intensity in arbitrary
units and proportional to the mean intensity incident on the pixels of a same column
is shown as a function of the position along the spectrum identified by the column
number (from 1 to 640).
Of course, at this stage, the obtained graph does not contain any physical
information (i.e., wavelength) on the spectrum: it is necessary to calibrate the
graph in order to obtain calibrated spectra. The software allows to calibrate the
measure: it is enough to select the type of used diffraction grating (the dimension of
the rating pitch fixes the pixel–wavelength relationship) or, alternatively a calibration source can also be used: fixing the position of a known wavelength allows to
calibrate the measure making the hypothesis of a linear relation between position
along the sensor and relative wavelength. After those operations, a calibrated graph
appears in which the horizontal axis is in wavelength (nm) or in energy (eV), since
the code is equipped with the energy-wavelength inverse proportionality relation: a
reference spectrum appears under the graph showing an energy scale. Two movable
markers allow to sign the position of the image (zeroth order) and a generic position
along the spectrum of the first order, resulting in a univocal measure of wavelength
(expressed in nm) or energy (expressed in eV) (Fig. 22.5, right). In this way, student
appreciates that every linear position along the CCD sensor corresponds to an
angular position α that can be univocally coupled to a wavelength λ with the grating
formula (where d is the pitch and m the order of the spectra):
d ∙ sin α ¼ m ∙ λ
Fig. 22.5 SPETTROGRAFO system connected to PC, pointing the source (left) and calibrated
yellow LED spectra (right). The yellow marker on the left targets the zeroth order, while the red
marker, moving along the spectrum, allows to measure the energy or wavelength of the
corresponding position
22 SPETTROGRAFO: A Digital Spectrometer for Educational Lab Activities
277