

effect of placing a grating in front of a light source. The user limits himself to line up
the zeroth order of the diffraction pattern with a reference to automatically and
uniquely associate a position along the pixel array with a specific wavelength
(Fig. 22.1, right).
Both the quickly described devices are quite similar to “closed black boxes,” in
the sense that, despite their high quality performance, they do not allow user to
approach the physics of the measure or to change the experimental conditions.
Absorption measures are automatically generated by the software as well as the
calibration, that is an important phase of the measuring process.
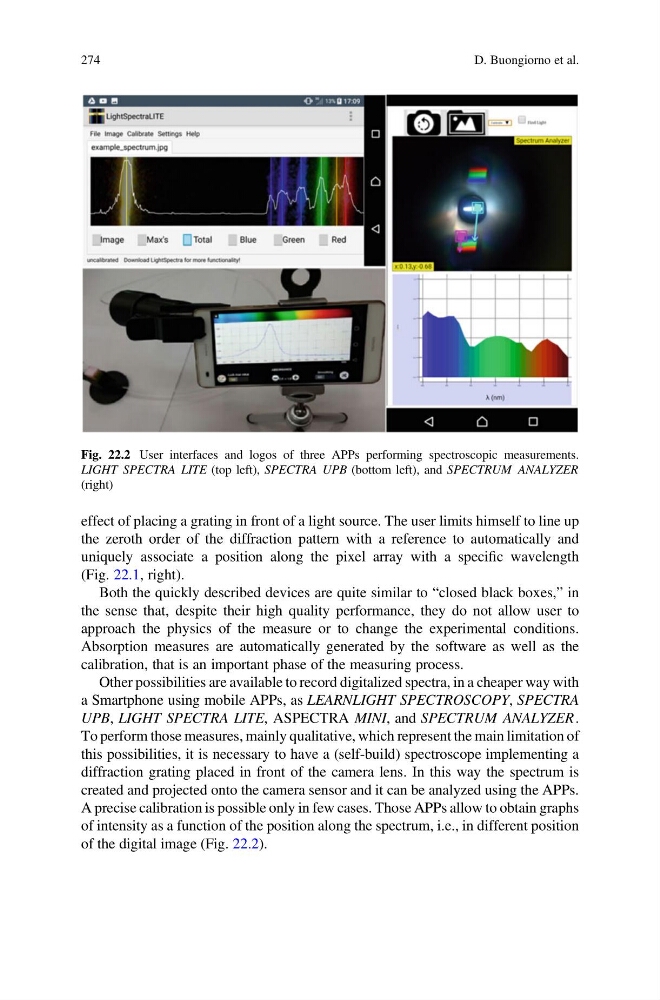
Other possibilities are available to record digitalized spectra, in a cheaper way with
a Smartphone using mobile APPs, as LEARNLIGHT SPECTROSCOPY, SPECTRA
UPB, LIGHT SPECTRA LITE, ASPECTRA MINI, and SPECTRUM ANALYZER .
To perform those measures, mainly qualitative, which represent the main limitation of
this possibilities, it is necessary to have a (self-build) spectroscope implementing a
diffraction grating placed in front of the camera lens. In this way the spectrum is
created and projected onto the camera sensor and it can be analyzed using the APPs.
A precise calibration is possible only in few cases. Those APPs allow to obtain graphs
of intensity as a function of the position along the spectrum, i.e., in different position
of the digital image (Fig. 22.2).
Fig. 22.2 User interfaces and logos of three APPs performing spectroscopic measurements.
LIGHT SPECTRA LITE (top left), SPECTRA UPB (bottom left), and SPECTRUM ANALYZER
(right)
274
D. Buongiorno et al.
the zeroth order of the diffraction pattern with a reference to automatically and
uniquely associate a position along the pixel array with a specific wavelength
(Fig. 22.1, right).
Both the quickly described devices are quite similar to “closed black boxes,” in
the sense that, despite their high quality performance, they do not allow user to
approach the physics of the measure or to change the experimental conditions.
Absorption measures are automatically generated by the software as well as the
calibration, that is an important phase of the measuring process.
Other possibilities are available to record digitalized spectra, in a cheaper way with
a Smartphone using mobile APPs, as LEARNLIGHT SPECTROSCOPY, SPECTRA
UPB, LIGHT SPECTRA LITE, ASPECTRA MINI, and SPECTRUM ANALYZER .
To perform those measures, mainly qualitative, which represent the main limitation of
this possibilities, it is necessary to have a (self-build) spectroscope implementing a
diffraction grating placed in front of the camera lens. In this way the spectrum is
created and projected onto the camera sensor and it can be analyzed using the APPs.
A precise calibration is possible only in few cases. Those APPs allow to obtain graphs
of intensity as a function of the position along the spectrum, i.e., in different position
of the digital image (Fig. 22.2).
Fig. 22.2 User interfaces and logos of three APPs performing spectroscopic measurements.
LIGHT SPECTRA LITE (top left), SPECTRA UPB (bottom left), and SPECTRUM ANALYZER
(right)
274
D. Buongiorno et al.