

22.2 Some Existing Proposals
The PASCO PS-2600 wireless spectrometer
1 contains a dispersive element
(a diffraction grating) and a CCD sensor (sensibility between 380 and 980 nm).
Light is guided from the source to be analyzed to the dispersive element with the aid
of an optical fiber. The dispersive element creates the spectrum which is projected to
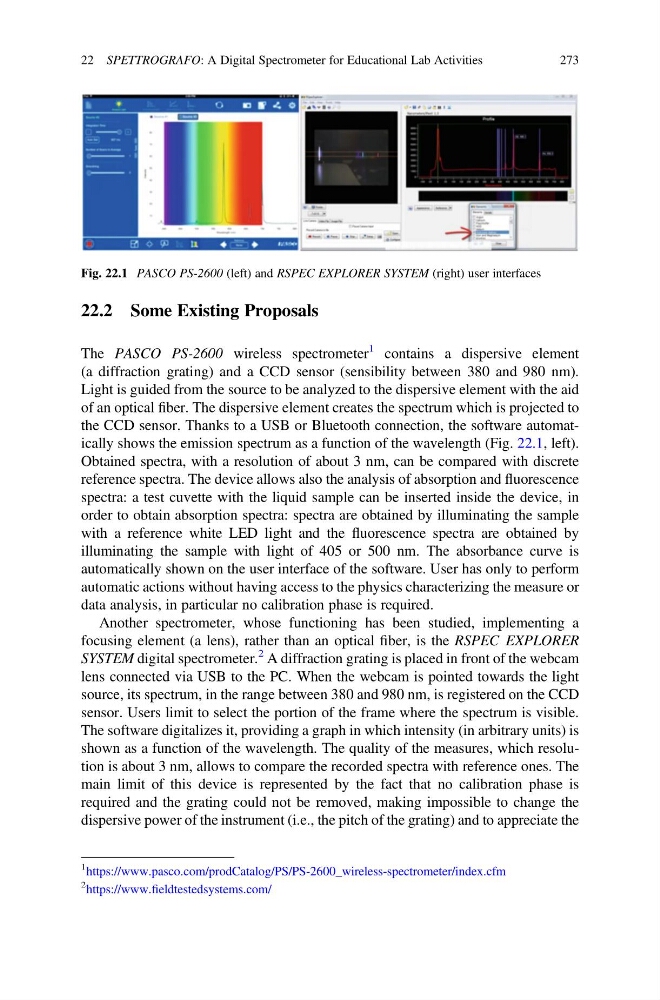
the CCD sensor. Thanks to a USB or Bluetooth connection, the software automatically shows the emission spectrum as a function of the wavelength (Fig. 22.1, left).
Obtained spectra, with a resolution of about 3 nm, can be compared with discrete
reference spectra. The device allows also the analysis of absorption and fluorescence
spectra: a test cuvette with the liquid sample can be inserted inside the device, in
order to obtain absorption spectra: spectra are obtained by illuminating the sample
with a reference white LED light and the fluorescence spectra are obtained by
illuminating the sample with light of 405 or 500 nm. The absorbance curve is
automatically shown on the user interface of the software. User has only to perform
automatic actions without having access to the physics characterizing the measure or
data analysis, in particular no calibration phase is required.
Another spectrometer, whose functioning has been studied, implementing a
focusing element (a lens), rather than an optical fiber, is the RSPEC EXPLORER
SYSTEM digital spectrometer.
2 A diffraction grating is placed in front of the webcam
lens connected via USB to the PC. When the webcam is pointed towards the light
source, its spectrum, in the range between 380 and 980 nm, is registered on the CCD
sensor. Users limit to select the portion of the frame where the spectrum is visible.
The software digitalizes it, providing a graph in which intensity (in arbitrary units) is
shown as a function of the wavelength. The quality of the measures, which resolution is about 3 nm, allows to compare the recorded spectra with reference ones. The
main limit of this device is represented by the fact that no calibration phase is
required and the grating could not be removed, making impossible to change the
dispersive power of the instrument (i.e., the pitch of the grating) and to appreciate the
Fig. 22.1 PASCO PS-2600 (left) and RSPEC EXPLORER SYSTEM (right) user interfaces
1 https://www.pasco.com/prodCatalog/PS/PS-2600_wireless-spectrometer/index.cfm
2 https://www.fieldtestedsystems.com/
22 SPETTROGRAFO: A Digital Spectrometer for Educational Lab Activities
273
The PASCO PS-2600 wireless spectrometer
1 contains a dispersive element
(a diffraction grating) and a CCD sensor (sensibility between 380 and 980 nm).
Light is guided from the source to be analyzed to the dispersive element with the aid
of an optical fiber. The dispersive element creates the spectrum which is projected to
the CCD sensor. Thanks to a USB or Bluetooth connection, the software automatically shows the emission spectrum as a function of the wavelength (Fig. 22.1, left).
Obtained spectra, with a resolution of about 3 nm, can be compared with discrete
reference spectra. The device allows also the analysis of absorption and fluorescence
spectra: a test cuvette with the liquid sample can be inserted inside the device, in
order to obtain absorption spectra: spectra are obtained by illuminating the sample
with a reference white LED light and the fluorescence spectra are obtained by
illuminating the sample with light of 405 or 500 nm. The absorbance curve is
automatically shown on the user interface of the software. User has only to perform
automatic actions without having access to the physics characterizing the measure or
data analysis, in particular no calibration phase is required.
Another spectrometer, whose functioning has been studied, implementing a
focusing element (a lens), rather than an optical fiber, is the RSPEC EXPLORER
SYSTEM digital spectrometer.
2 A diffraction grating is placed in front of the webcam
lens connected via USB to the PC. When the webcam is pointed towards the light
source, its spectrum, in the range between 380 and 980 nm, is registered on the CCD
sensor. Users limit to select the portion of the frame where the spectrum is visible.
The software digitalizes it, providing a graph in which intensity (in arbitrary units) is
shown as a function of the wavelength. The quality of the measures, which resolution is about 3 nm, allows to compare the recorded spectra with reference ones. The
main limit of this device is represented by the fact that no calibration phase is
required and the grating could not be removed, making impossible to change the
dispersive power of the instrument (i.e., the pitch of the grating) and to appreciate the
Fig. 22.1 PASCO PS-2600 (left) and RSPEC EXPLORER SYSTEM (right) user interfaces
1 https://www.pasco.com/prodCatalog/PS/PS-2600_wireless-spectrometer/index.cfm
2 https://www.fieldtestedsystems.com/
22 SPETTROGRAFO: A Digital Spectrometer for Educational Lab Activities
273