

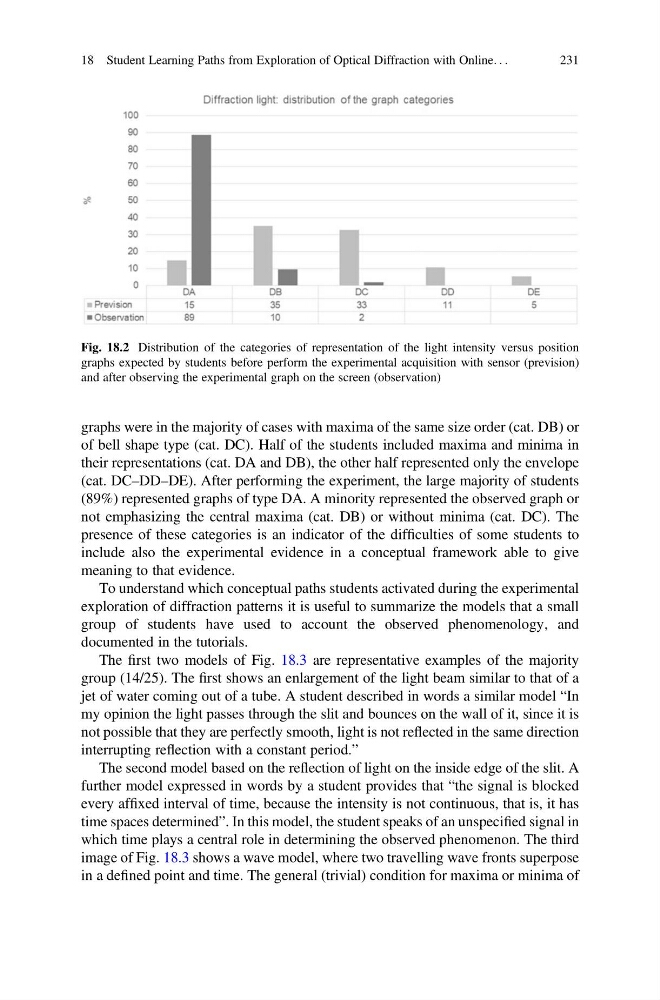
graphs were in the majority of cases with maxima of the same size order (cat. DB) or
of bell shape type (cat. DC). Half of the students included maxima and minima in
their representations (cat. DA and DB), the other half represented only the envelope
(cat. DC–DD–DE). After performing the experiment, the large majority of students
(89%) represented graphs of type DA. A minority represented the observed graph or
not emphasizing the central maxima (cat. DB) or without minima (cat. DC). The
presence of these categories is an indicator of the difficulties of some students to
include also the experimental evidence in a conceptual framework able to give
meaning to that evidence.
To understand which conceptual paths students activated during the experimental
exploration of diffraction patterns it is useful to summarize the models that a small
group of students have used to account the observed phenomenology, and
documented in the tutorials.
The first two models of Fig. 18.3 are representative examples of the majority
group (14/25). The first shows an enlargement of the light beam similar to that of a
jet of water coming out of a tube. A student described in words a similar model “In
my opinion the light passes through the slit and bounces on the wall of it, since it is
not possible that they are perfectly smooth, light is not reflected in the same direction
interrupting reflection with a constant period.”
The second model based on the reflection of light on the inside edge of the slit. A
further model expressed in words by a student provides that “the signal is blocked
every affixed interval of time, because the intensity is not continuous, that is, it has
time spaces determined”. In this model, the student speaks of an unspecified signal in
which time plays a central role in determining the observed phenomenon. The third
image of Fig. 18.3 shows a wave model, where two travelling wave fronts superpose
in a defined point and time. The general (trivial) condition for maxima or minima of
Fig. 18.2 Distribution of the categories of representation of the light intensity versus position
graphs expected by students before perform the experimental acquisition with sensor (prevision)
and after observing the experimental graph on the screen (observation)
18 Student Learning Paths from Exploration of Optical Diffraction with Online. . .
231
of bell shape type (cat. DC). Half of the students included maxima and minima in
their representations (cat. DA and DB), the other half represented only the envelope
(cat. DC–DD–DE). After performing the experiment, the large majority of students
(89%) represented graphs of type DA. A minority represented the observed graph or
not emphasizing the central maxima (cat. DB) or without minima (cat. DC). The
presence of these categories is an indicator of the difficulties of some students to
include also the experimental evidence in a conceptual framework able to give
meaning to that evidence.
To understand which conceptual paths students activated during the experimental
exploration of diffraction patterns it is useful to summarize the models that a small
group of students have used to account the observed phenomenology, and
documented in the tutorials.
The first two models of Fig. 18.3 are representative examples of the majority
group (14/25). The first shows an enlargement of the light beam similar to that of a
jet of water coming out of a tube. A student described in words a similar model “In
my opinion the light passes through the slit and bounces on the wall of it, since it is
not possible that they are perfectly smooth, light is not reflected in the same direction
interrupting reflection with a constant period.”
The second model based on the reflection of light on the inside edge of the slit. A
further model expressed in words by a student provides that “the signal is blocked
every affixed interval of time, because the intensity is not continuous, that is, it has
time spaces determined”. In this model, the student speaks of an unspecified signal in
which time plays a central role in determining the observed phenomenon. The third
image of Fig. 18.3 shows a wave model, where two travelling wave fronts superpose
in a defined point and time. The general (trivial) condition for maxima or minima of
Fig. 18.2 Distribution of the categories of representation of the light intensity versus position
graphs expected by students before perform the experimental acquisition with sensor (prevision)
and after observing the experimental graph on the screen (observation)
18 Student Learning Paths from Exploration of Optical Diffraction with Online. . .
231