

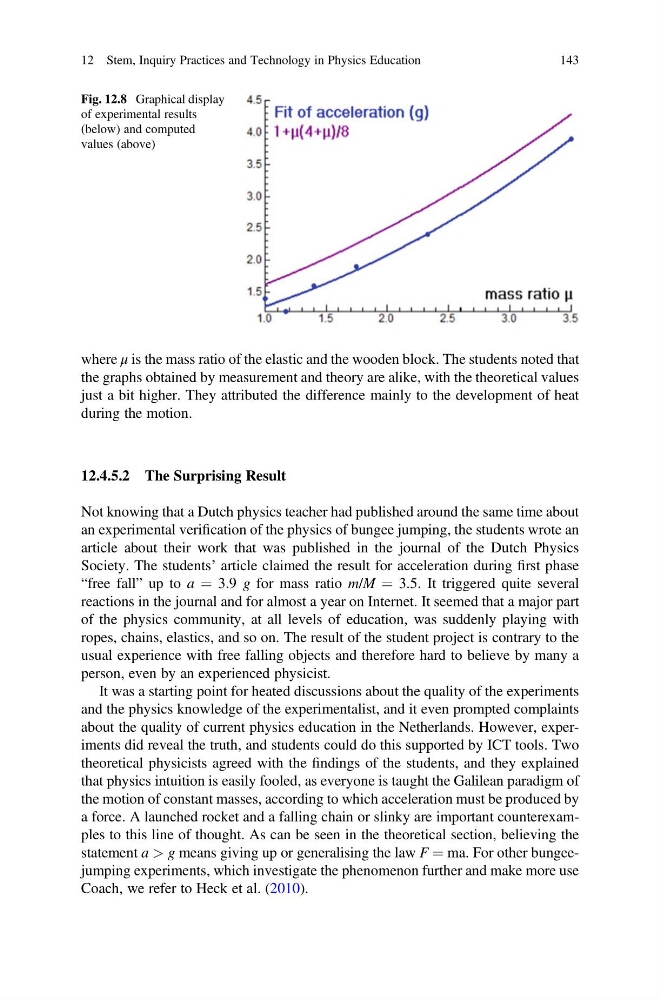
where μ is the mass ratio of the elastic and the wooden block. The students noted that
the graphs obtained by measurement and theory are alike, with the theoretical values
just a bit higher. They attributed the difference mainly to the development of heat
during the motion.
12.4.5.2 The Surprising Result
Not knowing that a Dutch physics teacher had published around the same time about
an experimental verification of the physics of bungee jumping, the students wrote an
article about their work that was published in the journal of the Dutch Physics
Society. The students’ article claimed the result for acceleration during first phase
“free fall” up to a ¼ 3.9 g for mass ratio m/M ¼ 3.5. It triggered quite several
reactions in the journal and for almost a year on Internet. It seemed that a major part
of the physics community, at all levels of education, was suddenly playing with
ropes, chains, elastics, and so on. The result of the student project is contrary to the
usual experience with free falling objects and therefore hard to believe by many a
person, even by an experienced physicist.
It was a starting point for heated discussions about the quality of the experiments
and the physics knowledge of the experimentalist, and it even prompted complaints
about the quality of current physics education in the Netherlands. However, experiments did reveal the truth, and students could do this supported by ICT tools. Two
theoretical physicists agreed with the findings of the students, and they explained
that physics intuition is easily fooled, as everyone is taught the Galilean paradigm of
the motion of constant masses, according to which acceleration must be produced by
a force. A launched rocket and a falling chain or slinky are important counterexamples to this line of thought. As can be seen in the theoretical section, believing the
statement a > g means giving up or generalising the law F ¼ ma. For other bungeejumping experiments, which investigate the phenomenon further and make more use
Coach, we refer to Heck et al. (2010).
Fig. 12.8 Graphical display
of experimental results
(below) and computed
values (above)
12 Stem, Inquiry Practices and Technology in Physics Education
143
the graphs obtained by measurement and theory are alike, with the theoretical values
just a bit higher. They attributed the difference mainly to the development of heat
during the motion.
12.4.5.2 The Surprising Result
Not knowing that a Dutch physics teacher had published around the same time about
an experimental verification of the physics of bungee jumping, the students wrote an
article about their work that was published in the journal of the Dutch Physics
Society. The students’ article claimed the result for acceleration during first phase
“free fall” up to a ¼ 3.9 g for mass ratio m/M ¼ 3.5. It triggered quite several
reactions in the journal and for almost a year on Internet. It seemed that a major part
of the physics community, at all levels of education, was suddenly playing with
ropes, chains, elastics, and so on. The result of the student project is contrary to the
usual experience with free falling objects and therefore hard to believe by many a
person, even by an experienced physicist.
It was a starting point for heated discussions about the quality of the experiments
and the physics knowledge of the experimentalist, and it even prompted complaints
about the quality of current physics education in the Netherlands. However, experiments did reveal the truth, and students could do this supported by ICT tools. Two
theoretical physicists agreed with the findings of the students, and they explained
that physics intuition is easily fooled, as everyone is taught the Galilean paradigm of
the motion of constant masses, according to which acceleration must be produced by
a force. A launched rocket and a falling chain or slinky are important counterexamples to this line of thought. As can be seen in the theoretical section, believing the
statement a > g means giving up or generalising the law F ¼ ma. For other bungeejumping experiments, which investigate the phenomenon further and make more use
Coach, we refer to Heck et al. (2010).
Fig. 12.8 Graphical display
of experimental results
(below) and computed
values (above)
12 Stem, Inquiry Practices and Technology in Physics Education
143