

processing such as (a) fitting or modelling the data with analytic functions
(e.g. function fit); (b) integrating, differentiating data; and (c) displaying Fourier
transforms of the data (Sokoloff et al. 2007; Heck et al. 2009b). Moreover, swift
analysis and processing with three tools save time on labour intensive, repetitive
tasks (e.g. drawing graphs) and so allow pupils to focus on inquiry skills like
interpreting data, inferring relationships, and testing different assumptions, which
are otherwise impossible due to time constraints. These features of data processing
and analysis crucially add to specific characteristics of the three Coach tools mentioned above. This makes each of the ICT tools an authentic platform where pupils
can easily move back and forth between the physical and theoretical worlds within
the classroom time to generate or validate knowledge of science.
12.4.5 An Example of ICT in a Student Project: A Surprising
Result
12.4.5.1 The Student Project with ICT: “Physics of Bungee Jumping”
The Dutch curricula require pupils to gain exposure to research projects in physics
and other subjects where they must make their own choices with respect to topic,
questions, and experiments/models; collect and analyse data; and compare outcomes
with literature. A final investigation project is intended for 80 h outside of regular
lessons and spread over a whole school year (about 2 h a week). In 2003, two Dutch
students teamed up to investigate the physics of bungee jumping. In the first phase of
bungee jumping, the bungee jumper falls, and the bungee rope is still slack. In
instructional material, this phase is often considered a free fall. Considering the mass
of the bungee rope, the students formulated the research question: How large is the
acceleration at a bungee jump and to what degree is this acceleration influenced by
the relative mass of the rope and the jumper?
The students collected position-time data through Coach video measurements on
a dropped scale model (an Action Man toy figure) and on dropped wooden blocks of
various weights attached to ropes of various stiffness. The velocity and acceleration
of the dropped object were computed by numerical differentiation. Soon the students
realised that the mass ratio between rope and objects was too low to see an
outstanding result and they repeated the experiment with objects of larger mass
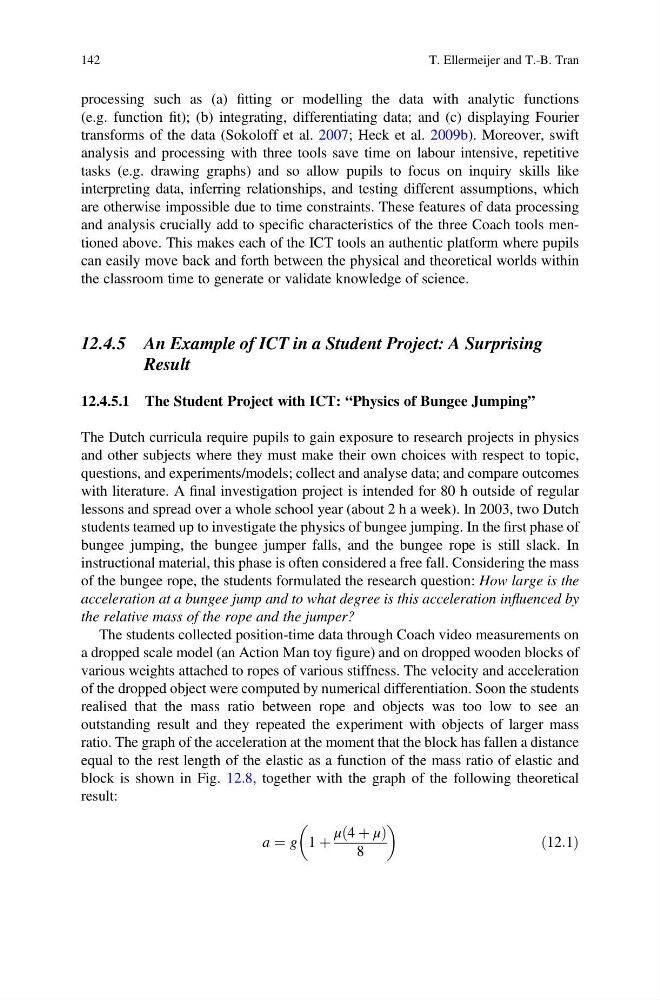
ratio. The graph of the acceleration at the moment that the block has fallen a distance
equal to the rest length of the elastic as a function of the mass ratio of elastic and
block is shown in Fig. 12.8, together with the graph of the following theoretical
result:
a ¼ g 1 þ
μ 4 þ μ
ð
Þ
8
ð12:1Þ
142
T. Ellermeijer and T.-B. Tran
(e.g. function fit); (b) integrating, differentiating data; and (c) displaying Fourier
transforms of the data (Sokoloff et al. 2007; Heck et al. 2009b). Moreover, swift
analysis and processing with three tools save time on labour intensive, repetitive
tasks (e.g. drawing graphs) and so allow pupils to focus on inquiry skills like
interpreting data, inferring relationships, and testing different assumptions, which
are otherwise impossible due to time constraints. These features of data processing
and analysis crucially add to specific characteristics of the three Coach tools mentioned above. This makes each of the ICT tools an authentic platform where pupils
can easily move back and forth between the physical and theoretical worlds within
the classroom time to generate or validate knowledge of science.
12.4.5 An Example of ICT in a Student Project: A Surprising
Result
12.4.5.1 The Student Project with ICT: “Physics of Bungee Jumping”
The Dutch curricula require pupils to gain exposure to research projects in physics
and other subjects where they must make their own choices with respect to topic,
questions, and experiments/models; collect and analyse data; and compare outcomes
with literature. A final investigation project is intended for 80 h outside of regular
lessons and spread over a whole school year (about 2 h a week). In 2003, two Dutch
students teamed up to investigate the physics of bungee jumping. In the first phase of
bungee jumping, the bungee jumper falls, and the bungee rope is still slack. In
instructional material, this phase is often considered a free fall. Considering the mass
of the bungee rope, the students formulated the research question: How large is the
acceleration at a bungee jump and to what degree is this acceleration influenced by
the relative mass of the rope and the jumper?
The students collected position-time data through Coach video measurements on
a dropped scale model (an Action Man toy figure) and on dropped wooden blocks of
various weights attached to ropes of various stiffness. The velocity and acceleration
of the dropped object were computed by numerical differentiation. Soon the students
realised that the mass ratio between rope and objects was too low to see an
outstanding result and they repeated the experiment with objects of larger mass
ratio. The graph of the acceleration at the moment that the block has fallen a distance
equal to the rest length of the elastic as a function of the mass ratio of elastic and
block is shown in Fig. 12.8, together with the graph of the following theoretical
result:
a ¼ g 1 þ
μ 4 þ μ
ð
Þ
8
ð12:1Þ
142
T. Ellermeijer and T.-B. Tran