

point. This procedure with the software is repeated until the user obtains a desired
number of data points.
Coach allows automated tracking of the movement of objects and enables
collection of different video points in a single video frame. Like the data logging
with sensors, during the manual measurement and automated tracking from a video,
the collected data are simultaneously displayed in a diagram or table (real-time
graphing) (Fig. 12.3). Other dynamics quantities such as velocity, acceleration,
momentum, kinetic energy, force can be numerically computed based on the collected data. Finally, collected and computed data are analysed and processed further
by the software. Video measurement is mostly limited to movement, so it is mostly
used in physics.
12.4.2.2 Examples of Coach Video-Measurement Activities
Figure 12.3 illustrates an experimentation activity facilitated by the videomeasurement tool. In this activity, position and time of a baseball is collected from
a high-speed video and displayed in the graph and table by the software. The dotted
cross in the graph indicates that the scan feature of the software is activated. In this
illustration, the data point (À 0.593 m, 0.145 s) on the graph and the table is scanned,
and the video advances to Frame 72, which shows the corresponding position of the
baseball.
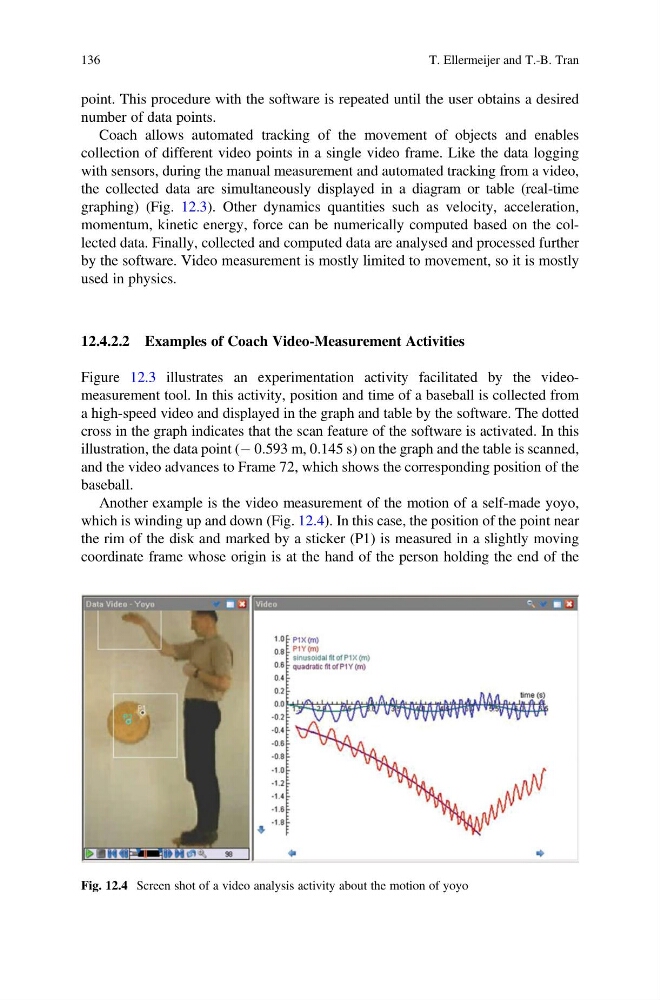
Another example is the video measurement of the motion of a self-made yoyo,
which is winding up and down (Fig. 12.4). In this case, the position of the point near
the rim of the disk and marked by a sticker (P1) is measured in a slightly moving
coordinate frame whose origin is at the hand of the person holding the end of the
Fig. 12.4 Screen shot of a video analysis activity about the motion of yoyo
136
T. Ellermeijer and T.-B. Tran
number of data points.
Coach allows automated tracking of the movement of objects and enables
collection of different video points in a single video frame. Like the data logging
with sensors, during the manual measurement and automated tracking from a video,
the collected data are simultaneously displayed in a diagram or table (real-time
graphing) (Fig. 12.3). Other dynamics quantities such as velocity, acceleration,
momentum, kinetic energy, force can be numerically computed based on the collected data. Finally, collected and computed data are analysed and processed further
by the software. Video measurement is mostly limited to movement, so it is mostly
used in physics.
12.4.2.2 Examples of Coach Video-Measurement Activities
Figure 12.3 illustrates an experimentation activity facilitated by the videomeasurement tool. In this activity, position and time of a baseball is collected from
a high-speed video and displayed in the graph and table by the software. The dotted
cross in the graph indicates that the scan feature of the software is activated. In this
illustration, the data point (À 0.593 m, 0.145 s) on the graph and the table is scanned,
and the video advances to Frame 72, which shows the corresponding position of the
baseball.
Another example is the video measurement of the motion of a self-made yoyo,
which is winding up and down (Fig. 12.4). In this case, the position of the point near
the rim of the disk and marked by a sticker (P1) is measured in a slightly moving
coordinate frame whose origin is at the hand of the person holding the end of the
Fig. 12.4 Screen shot of a video analysis activity about the motion of yoyo
136
T. Ellermeijer and T.-B. Tran