

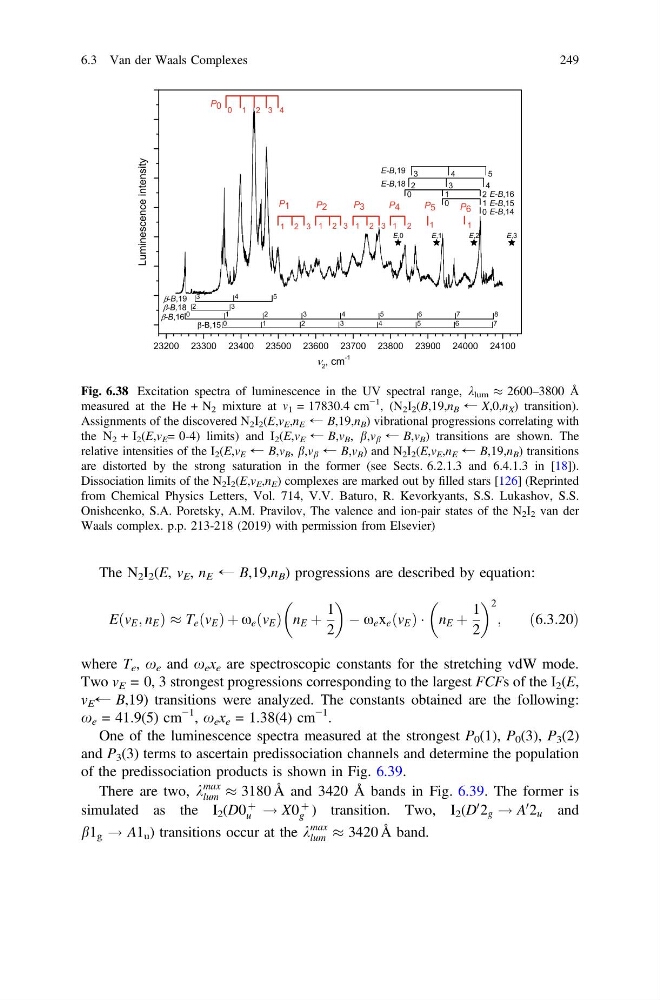
The N 2 I 2 (E, v E , n E ← B,19,n B ) progressions are described by equation:
E v E ; n E
ð
Þ%T e v E
ð Þþx e v E
ð Þ n E þ
1
2
À x e x e v E
ð Þ Á n E þ
1
2
2
;
ð6:3:20Þ
where T e , x e and x e x e are spectroscopic constants for the stretching vdW mode.
Two v E = 0, 3 strongest progressions corresponding to the largest FCFs of the I 2 (E,
v E ← B,19) transitions were analyzed. The constants obtained are the following:
x e = 41.9(5) cm
−1 , x e x e = 1.38(4) cm
−1 .
One of the luminescence spectra measured at the strongest P 0 (1), P 0 (3), P 3 (2)
and P 3 (3) terms to ascertain predissociation channels and determine the population
of the predissociation products is shown in Fig. 6.39.
There are two, k
max
lum % 3180 ˚
A and 3420 Å bands in Fig. 6.39. The former is
simulated as the I 2 (D0
þ
u ! X0
þ
g ) transition. Two, I 2 (D
0 2 g ! A
0 2 u and
b1 g ! A1 u ) transitions occur at the k
max
lum % 3420 ˚
A band.
Fig. 6.38 Excitation spectra of luminescence in the UV spectral range, k lum % 2600–3800 Å
measured at the He + N 2 mixture at m 1 = 17830.4 cm
−1
, (N 2 I 2 (B,19,n B ← X,0,n X ) transition).
Assignments of the discovered N 2 I 2 (E,v E ,n E ← B,19,n B ) vibrational progressions correlating with
the N 2 + I 2 (E,v E = 0-4) limits) and I 2 (E,v E ← B,v B , b,v b ← B,v B ) transitions are shown. The
relative intensities of the I 2 (E,v E ← B,v B , b,v b ← B,v B ) and N 2 I 2 (E,v E ,n E ← B,19,n B ) transitions
are distorted by the strong saturation in the former (see Sects. 6.2.1.3 and 6.4.1.3 in [18]).
Dissociation limits of the N 2 I 2 (E,v E ,n E ) complexes are marked out by filled stars [126] (Reprinted
from Chemical Physics Letters, Vol. 714, V.V. Baturo, R. Kevorkyants, S.S. Lukashov, S.S.
Onishcenko, S.A. Poretsky, A.M. Pravilov, The valence and ion-pair states of the N 2 I 2 van der
Waals complex. p.p. 213-218 (2019) with permission from Elsevier)
6.3 Van der Waals Complexes
249
E v E ; n E
ð
Þ%T e v E
ð Þþx e v E
ð Þ n E þ
1
2
À x e x e v E
ð Þ Á n E þ
1
2
2
;
ð6:3:20Þ
where T e , x e and x e x e are spectroscopic constants for the stretching vdW mode.
Two v E = 0, 3 strongest progressions corresponding to the largest FCFs of the I 2 (E,
v E ← B,19) transitions were analyzed. The constants obtained are the following:
x e = 41.9(5) cm
−1 , x e x e = 1.38(4) cm
−1 .
One of the luminescence spectra measured at the strongest P 0 (1), P 0 (3), P 3 (2)
and P 3 (3) terms to ascertain predissociation channels and determine the population
of the predissociation products is shown in Fig. 6.39.
There are two, k
max
lum % 3180 ˚
A and 3420 Å bands in Fig. 6.39. The former is
simulated as the I 2 (D0
þ
u ! X0
þ
g ) transition. Two, I 2 (D
0 2 g ! A
0 2 u and
b1 g ! A1 u ) transitions occur at the k
max
lum % 3420 ˚
A band.
Fig. 6.38 Excitation spectra of luminescence in the UV spectral range, k lum % 2600–3800 Å
measured at the He + N 2 mixture at m 1 = 17830.4 cm
−1
, (N 2 I 2 (B,19,n B ← X,0,n X ) transition).
Assignments of the discovered N 2 I 2 (E,v E ,n E ← B,19,n B ) vibrational progressions correlating with
the N 2 + I 2 (E,v E = 0-4) limits) and I 2 (E,v E ← B,v B , b,v b ← B,v B ) transitions are shown. The
relative intensities of the I 2 (E,v E ← B,v B , b,v b ← B,v B ) and N 2 I 2 (E,v E ,n E ← B,19,n B ) transitions
are distorted by the strong saturation in the former (see Sects. 6.2.1.3 and 6.4.1.3 in [18]).
Dissociation limits of the N 2 I 2 (E,v E ,n E ) complexes are marked out by filled stars [126] (Reprinted
from Chemical Physics Letters, Vol. 714, V.V. Baturo, R. Kevorkyants, S.S. Lukashov, S.S.
Onishcenko, S.A. Poretsky, A.M. Pravilov, The valence and ion-pair states of the N 2 I 2 van der
Waals complex. p.p. 213-218 (2019) with permission from Elsevier)
6.3 Van der Waals Complexes
249