

direct product of the species, corresponding to the B, E state vdW vibrational modes
and transition moments has a totally symmetric component, A 1 (see Sect. 4.2.1). It
is valid for the transitions to the NeI 2 (E,0,0,0; E,0,1,0, and E,0,0,2) states shown in
Fig. 6.17a, while those to the NeI 2 (E,0,0,1 and E,0,1,1) states are symmetry forbidden (m 2 % 23551.2 and 23565.2 cm
−1 , respectively).
These results contradict to those obtained later [102]
The wavenumbers of the bands corresponding to the stretching and bending
modes in Fig. 6.20 are described as following:
m
str
2 ¼ 23632:2 þ 24 Á v
str
E þ 1=2
À
Á À 1:6 Á v
str
E þ 1=2
À
Á 2 ðcm
À1
Þ
ð6:3:9Þ
m
b
2 ¼ 23632:2 þ 9:8 Á v
b
E þ 1=2
À
Á À 0:9 Á v
b
E þ 1=2
À
Á 2 ðcm
À1
Þ
ð6:3:10Þ
(see Fig. 6.21).
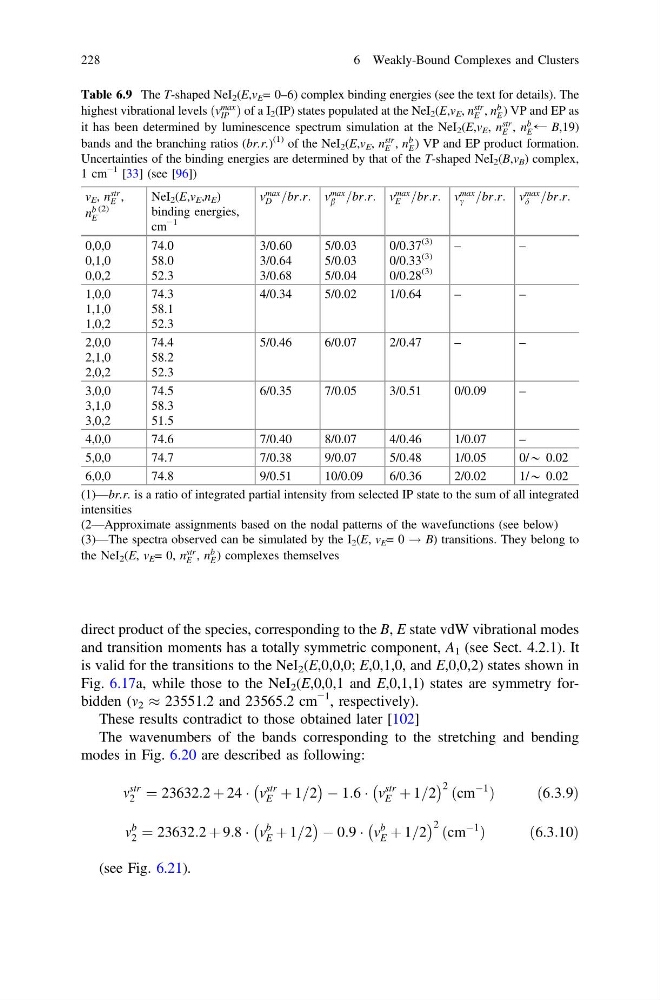
Table 6.9 The T-shaped NeI 2 (E,v E = 0–6) complex binding energies (see the text for details). The
highest vibrational levels ðv
max
IP Þ of a I 2 (IP) states populated at the NeI 2 (E,v E , n
str
E , n
b
E ) VP and EP as
it has been determined by luminescence spectrum simulation at the NeI 2 (E,v E , n
str
E , n
b
E ← B,19)
bands and the branching ratios (br.r.)
(1) of the NeI 2 (E,v E , n
str
E , n
b
E ) VP and EP product formation.
Uncertainties of the binding energies are determined by that of the T-shaped NeI 2 (B,v B ) complex,
1 cm
−1 [33] (see [96])
v E , n
str
E ,
n
b
E
(2)
NeI 2 (E,v E ,n E )
binding energies,
cm
−1
v
max
D =br:r: v
max
b =br:r: v
max
E =br:r: v
max
c =br:r: v
max
d =br:r:
0,0,0
0,1,0
0,0,2
74.0
58.0
52.3
3/0.60
3/0.64
3/0.68
5/0.03
5/0.03
5/0.04
0/0.37
(3)
0/0.33
(3)
0/0.28
(3)
–
–
1,0,0
1,1,0
1,0,2
74.3
58.1
52.3
4/0.34
5/0.02
1/0.64
–
–
2,0,0
2,1,0
2,0,2
74.4
58.2
52.3
5/0.46
6/0.07
2/0.47
–
–
3,0,0
3,1,0
3,0,2
74.5
58.3
51.5
6/0.35
7/0.05
3/0.51
0/0.09
–
4,0,0
74.6
7/0.40
8/0.07
4/0.46
1/0.07
–
5,0,0
74.7
7/0.38
9/0.07
5/0.48
1/0.05
0/* 0.02
6,0,0
74.8
9/0.51
10/0.09
6/0.36
2/0.02
1/* 0.02
(1)—br.r. is a ratio of integrated partial intensity from selected IP state to the sum of all integrated
intensities
(2—Approximate assignments based on the nodal patterns of the wavefunctions (see below)
(3)—The spectra observed can be simulated by the I 2 (E, v E = 0 ! B) transitions. They belong to
the NeI 2 (E, v E = 0, n
str
E , n
b
E ) complexes themselves
228
6 Weakly-Bound Complexes and Clusters
and transition moments has a totally symmetric component, A 1 (see Sect. 4.2.1). It
is valid for the transitions to the NeI 2 (E,0,0,0; E,0,1,0, and E,0,0,2) states shown in
Fig. 6.17a, while those to the NeI 2 (E,0,0,1 and E,0,1,1) states are symmetry forbidden (m 2 % 23551.2 and 23565.2 cm
−1 , respectively).
These results contradict to those obtained later [102]
The wavenumbers of the bands corresponding to the stretching and bending
modes in Fig. 6.20 are described as following:
m
str
2 ¼ 23632:2 þ 24 Á v
str
E þ 1=2
À
Á À 1:6 Á v
str
E þ 1=2
À
Á 2 ðcm
À1
Þ
ð6:3:9Þ
m
b
2 ¼ 23632:2 þ 9:8 Á v
b
E þ 1=2
À
Á À 0:9 Á v
b
E þ 1=2
À
Á 2 ðcm
À1
Þ
ð6:3:10Þ
(see Fig. 6.21).
Table 6.9 The T-shaped NeI 2 (E,v E = 0–6) complex binding energies (see the text for details). The
highest vibrational levels ðv
max
IP Þ of a I 2 (IP) states populated at the NeI 2 (E,v E , n
str
E , n
b
E ) VP and EP as
it has been determined by luminescence spectrum simulation at the NeI 2 (E,v E , n
str
E , n
b
E ← B,19)
bands and the branching ratios (br.r.)
(1) of the NeI 2 (E,v E , n
str
E , n
b
E ) VP and EP product formation.
Uncertainties of the binding energies are determined by that of the T-shaped NeI 2 (B,v B ) complex,
1 cm
−1 [33] (see [96])
v E , n
str
E ,
n
b
E
(2)
NeI 2 (E,v E ,n E )
binding energies,
cm
−1
v
max
D =br:r: v
max
b =br:r: v
max
E =br:r: v
max
c =br:r: v
max
d =br:r:
0,0,0
0,1,0
0,0,2
74.0
58.0
52.3
3/0.60
3/0.64
3/0.68
5/0.03
5/0.03
5/0.04
0/0.37
(3)
0/0.33
(3)
0/0.28
(3)
–
–
1,0,0
1,1,0
1,0,2
74.3
58.1
52.3
4/0.34
5/0.02
1/0.64
–
–
2,0,0
2,1,0
2,0,2
74.4
58.2
52.3
5/0.46
6/0.07
2/0.47
–
–
3,0,0
3,1,0
3,0,2
74.5
58.3
51.5
6/0.35
7/0.05
3/0.51
0/0.09
–
4,0,0
74.6
7/0.40
8/0.07
4/0.46
1/0.07
–
5,0,0
74.7
7/0.38
9/0.07
5/0.48
1/0.05
0/* 0.02
6,0,0
74.8
9/0.51
10/0.09
6/0.36
2/0.02
1/* 0.02
(1)—br.r. is a ratio of integrated partial intensity from selected IP state to the sum of all integrated
intensities
(2—Approximate assignments based on the nodal patterns of the wavefunctions (see below)
(3)—The spectra observed can be simulated by the I 2 (E, v E = 0 ! B) transitions. They belong to
the NeI 2 (E, v E = 0, n
str
E , n
b
E ) complexes themselves
228
6 Weakly-Bound Complexes and Clusters