

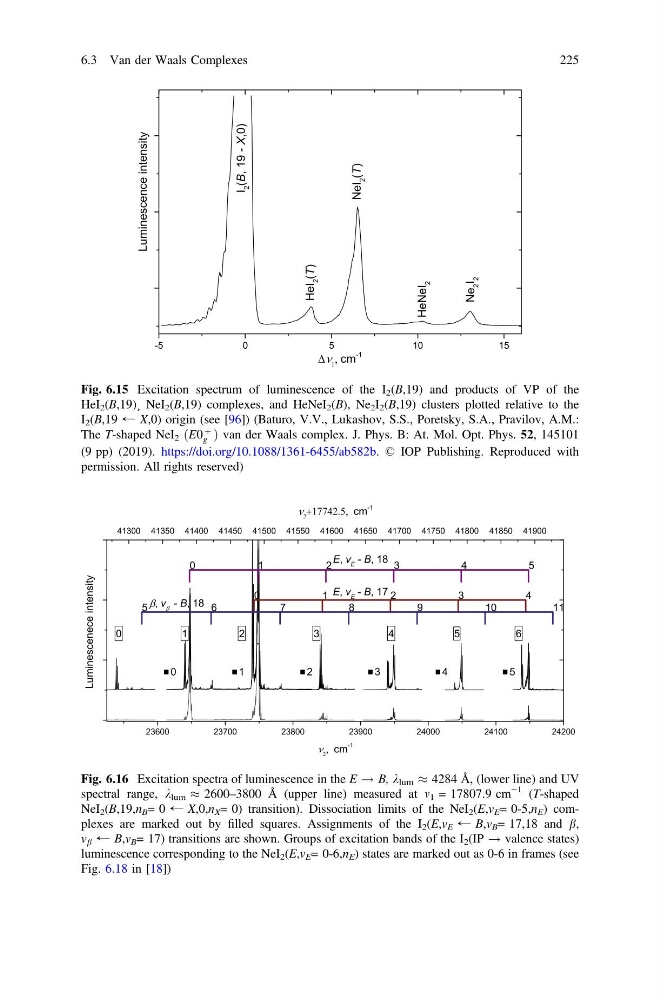
Fig. 6.15 Excitation spectrum of luminescence of the I 2 (B,19) and products of VP of the
HeI 2 (B,19)¸ NeI 2 (B,19) complexes, and HeNeI 2 (B), Ne 2 I 2 (B,19) clusters plotted relative to the
I 2 (B,19 ← X,0) origin (see [96]) (Baturo, V.V., Lukashov, S.S., Poretsky, S.A., Pravilov, A.M.:
The T-shaped NeI 2 ðE0
þ
g Þ van der Waals complex. J. Phys. B: At. Mol. Opt. Phys. 52, 145101
(9 pp) (2019). https://doi.org/10.1088/1361-6455/ab582b. © IOP Publishing. Reproduced with
permission. All rights reserved)
Fig. 6.16 Excitation spectra of luminescence in the E ! B, k lum % 4284 Å, (lower line) and UV
spectral range, k lum % 2600–3800 Å (upper line) measured at m 1 = 17807.9 cm
−1 (T-shaped
NeI 2 (B,19,n B = 0 ← X,0,n X = 0) transition). Dissociation limits of the NeI 2 (E,v E = 0-5,n E ) complexes are marked out by filled squares. Assignments of the I 2 (E,v E ← B,v B = 17,18 and b,
v b ← B,v B = 17) transitions are shown. Groups of excitation bands of the I 2 (IP ! valence states)
luminescence corresponding to the NeI 2 (E,v E = 0-6,n E ) states are marked out as 0-6 in frames (see
Fig. 6.18 in [18])
6.3 Van der Waals Complexes
225
HeI 2 (B,19)¸ NeI 2 (B,19) complexes, and HeNeI 2 (B), Ne 2 I 2 (B,19) clusters plotted relative to the
I 2 (B,19 ← X,0) origin (see [96]) (Baturo, V.V., Lukashov, S.S., Poretsky, S.A., Pravilov, A.M.:
The T-shaped NeI 2 ðE0
þ
g Þ van der Waals complex. J. Phys. B: At. Mol. Opt. Phys. 52, 145101
(9 pp) (2019). https://doi.org/10.1088/1361-6455/ab582b. © IOP Publishing. Reproduced with
permission. All rights reserved)
Fig. 6.16 Excitation spectra of luminescence in the E ! B, k lum % 4284 Å, (lower line) and UV
spectral range, k lum % 2600–3800 Å (upper line) measured at m 1 = 17807.9 cm
−1 (T-shaped
NeI 2 (B,19,n B = 0 ← X,0,n X = 0) transition). Dissociation limits of the NeI 2 (E,v E = 0-5,n E ) complexes are marked out by filled squares. Assignments of the I 2 (E,v E ← B,v B = 17,18 and b,
v b ← B,v B = 17) transitions are shown. Groups of excitation bands of the I 2 (IP ! valence states)
luminescence corresponding to the NeI 2 (E,v E = 0-6,n E ) states are marked out as 0-6 in frames (see
Fig. 6.18 in [18])
6.3 Van der Waals Complexes
225