

(E = −15.81 cm
−1 ) and corresponds to the helium atom localized in the T-shaped
configuration (see Table 6.4). These data contradict to those in [72]. The n X > 2
bound levels with J X = 0 are close to or above the barrier for free rotation of the
helium around the Br 2 and have amplitudes in the h = (0–180)
o range. There are
n X = 0–6 bound states (E = −(16.46– 3.12) cm
−1 ), and none of these states contain
vibrational excitation in the He–Br 2 stretching coordinate (see [74] and references).
There is potential barrier of *10 cm
−1 separating the n X = 0, 1 states of linear
He
79 Br 2 (X, v X = 0 and the n X = 2 states of the T-shaped conformer [74].
There is a well resolved feature in the HeBr 2 (B, v B = 8, 12, 21, n B ← X, v X = 0,
n X ) excitation spectra at *2.5 and *4 cm
−1 (calculation and experiment) as well a
series of transitions in the broader feature those are peaked at 10 cm
−1 from the
HeBr 2 (B, v B = 8, 12, 21 ← X, v X = 0) origins. The lower-energy feature is associated with transitions from the T-shaped HeBr 2 (X, v X = 0) vdW levels to the
lowest-energy state (n B = 0) on the B-state potential. The broader feature at higher
energy reflects transitions from all three lowest-energy levels on the X state,
n X = 0–2, to excited intermolecular vibrational levels on the B surface, n B ! 1.
The lines attributed to transitions from the linear n X = 0, 1 levels that appear within
the higher-energy features tend to be more intense than those from the T-shaped,
n X = 2 level (see [74]). The binding energy of the HeBr 2 (B, v B = 44) complex is
D 0 = (13.5 ± 1.0) cm
−1 .
(a)
(b)
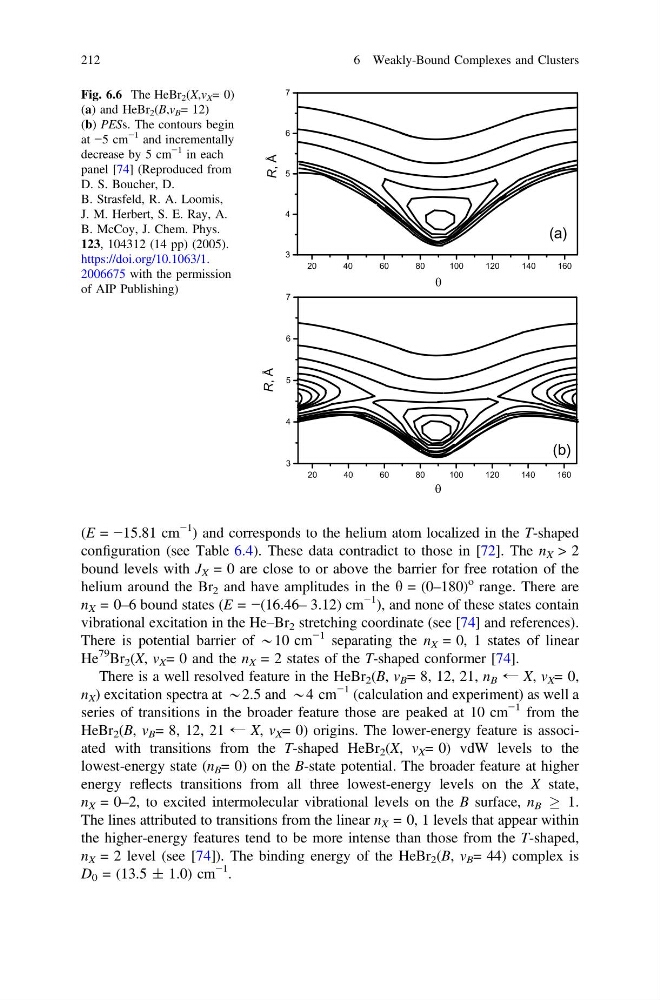
Fig. 6.6 The HeBr 2 (X,v X = 0)
(a) and HeBr 2 (B,v B = 12)
(b) PESs. The contours begin
at −5 cm
−1 and incrementally
decrease by 5 cm
−1 in each
panel [74] (Reproduced from
D. S. Boucher, D.
B. Strasfeld, R. A. Loomis,
J. M. Herbert, S. E. Ray, A.
B. McCoy, J. Chem. Phys.
123, 104312 (14 pp) (2005).
https://doi.org/10.1063/1.
2006675 with the permission
of AIP Publishing)
212
6 Weakly-Bound Complexes and Clusters
−1 ) and corresponds to the helium atom localized in the T-shaped
configuration (see Table 6.4). These data contradict to those in [72]. The n X > 2
bound levels with J X = 0 are close to or above the barrier for free rotation of the
helium around the Br 2 and have amplitudes in the h = (0–180)
o range. There are
n X = 0–6 bound states (E = −(16.46– 3.12) cm
−1 ), and none of these states contain
vibrational excitation in the He–Br 2 stretching coordinate (see [74] and references).
There is potential barrier of *10 cm
−1 separating the n X = 0, 1 states of linear
He
79 Br 2 (X, v X = 0 and the n X = 2 states of the T-shaped conformer [74].
There is a well resolved feature in the HeBr 2 (B, v B = 8, 12, 21, n B ← X, v X = 0,
n X ) excitation spectra at *2.5 and *4 cm
−1 (calculation and experiment) as well a
series of transitions in the broader feature those are peaked at 10 cm
−1 from the
HeBr 2 (B, v B = 8, 12, 21 ← X, v X = 0) origins. The lower-energy feature is associated with transitions from the T-shaped HeBr 2 (X, v X = 0) vdW levels to the
lowest-energy state (n B = 0) on the B-state potential. The broader feature at higher
energy reflects transitions from all three lowest-energy levels on the X state,
n X = 0–2, to excited intermolecular vibrational levels on the B surface, n B ! 1.
The lines attributed to transitions from the linear n X = 0, 1 levels that appear within
the higher-energy features tend to be more intense than those from the T-shaped,
n X = 2 level (see [74]). The binding energy of the HeBr 2 (B, v B = 44) complex is
D 0 = (13.5 ± 1.0) cm
−1 .
(a)
(b)
Fig. 6.6 The HeBr 2 (X,v X = 0)
(a) and HeBr 2 (B,v B = 12)
(b) PESs. The contours begin
at −5 cm
−1 and incrementally
decrease by 5 cm
−1 in each
panel [74] (Reproduced from
D. S. Boucher, D.
B. Strasfeld, R. A. Loomis,
J. M. Herbert, S. E. Ray, A.
B. McCoy, J. Chem. Phys.
123, 104312 (14 pp) (2005).
https://doi.org/10.1063/1.
2006675 with the permission
of AIP Publishing)
212
6 Weakly-Bound Complexes and Clusters