

Table 6.4 The dissociation, D e , and binding, D 0 , energies (units, cm
−1
) as well as equilibrium
distances R e
(1) , R 0
(2) (Å) of the RgBr 2 (X,v X = 0) linear (H = 0
° ) and T-shaped (H = 90
°
) conformers
(see Fig. 6.1)
Linear
T-shaped
Rg Reference
D e
D 0
R e
R 0
D e
D 0
R e
R 0
He [72] (ab initio)
[73] (ab initio)
[74] (ab initio)
[74] (exp)
[75] (exp.)
[76]
48.8
49.45
17.2
16.03
16.46
17.0(8)
4.42
4.412 4.86
40.3
40.64
17.7
14.89
15.81
16.6(8)
17.0 ± 1.5
3.58
3.599
3.7(2)
Ne [72] (ab initio)
[77] (semiemp. values)
[78] (exp)
[79] (exp)
[80] (exp)
93.6
68.0
71 ± 3
4.49
83.9
92
67.3
71.2
70.5 ± 2.0
70.0 ± 1.1
3.60
3.52
3.67
3.68
Ar [72] (ab initio)
[81] (semiemp. values)
262.7
256.6
228.0
220.0
4.63
4.60
226.4
247.2
203.5
213.5
3.80
3.65
(1)—The equilibrium distances corresponding to the potential well depths
(2)—The equilibrium distances corresponding to the n X = 0 vdW modes
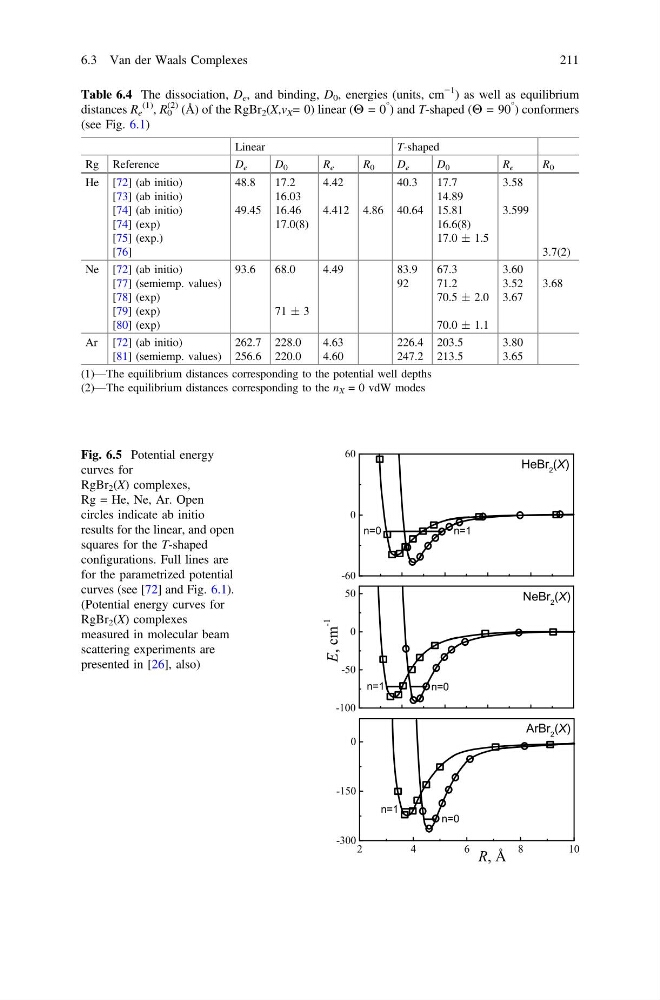
Fig. 6.5 Potential energy
curves for
RgBr 2 (X) complexes,
Rg = He, Ne, Ar. Open
circles indicate ab initio
results for the linear, and open
squares for the T-shaped
configurations. Full lines are
for the parametrized potential
curves (see [72] and Fig. 6.1).
(Potential energy curves for
RgBr 2 (X) complexes
measured in molecular beam
scattering experiments are
presented in [26], also)
6.3 Van der Waals Complexes
211
−1
) as well as equilibrium
distances R e
(1) , R 0
(2) (Å) of the RgBr 2 (X,v X = 0) linear (H = 0
° ) and T-shaped (H = 90
°
) conformers
(see Fig. 6.1)
Linear
T-shaped
Rg Reference
D e
D 0
R e
R 0
D e
D 0
R e
R 0
He [72] (ab initio)
[73] (ab initio)
[74] (ab initio)
[74] (exp)
[75] (exp.)
[76]
48.8
49.45
17.2
16.03
16.46
17.0(8)
4.42
4.412 4.86
40.3
40.64
17.7
14.89
15.81
16.6(8)
17.0 ± 1.5
3.58
3.599
3.7(2)
Ne [72] (ab initio)
[77] (semiemp. values)
[78] (exp)
[79] (exp)
[80] (exp)
93.6
68.0
71 ± 3
4.49
83.9
92
67.3
71.2
70.5 ± 2.0
70.0 ± 1.1
3.60
3.52
3.67
3.68
Ar [72] (ab initio)
[81] (semiemp. values)
262.7
256.6
228.0
220.0
4.63
4.60
226.4
247.2
203.5
213.5
3.80
3.65
(1)—The equilibrium distances corresponding to the potential well depths
(2)—The equilibrium distances corresponding to the n X = 0 vdW modes
Fig. 6.5 Potential energy
curves for
RgBr 2 (X) complexes,
Rg = He, Ne, Ar. Open
circles indicate ab initio
results for the linear, and open
squares for the T-shaped
configurations. Full lines are
for the parametrized potential
curves (see [72] and Fig. 6.1).
(Potential energy curves for
RgBr 2 (X) complexes
measured in molecular beam
scattering experiments are
presented in [26], also)
6.3 Van der Waals Complexes
211