

8 Fréedericksz-Like Positional Transition Triggered by An External Electric Field
339
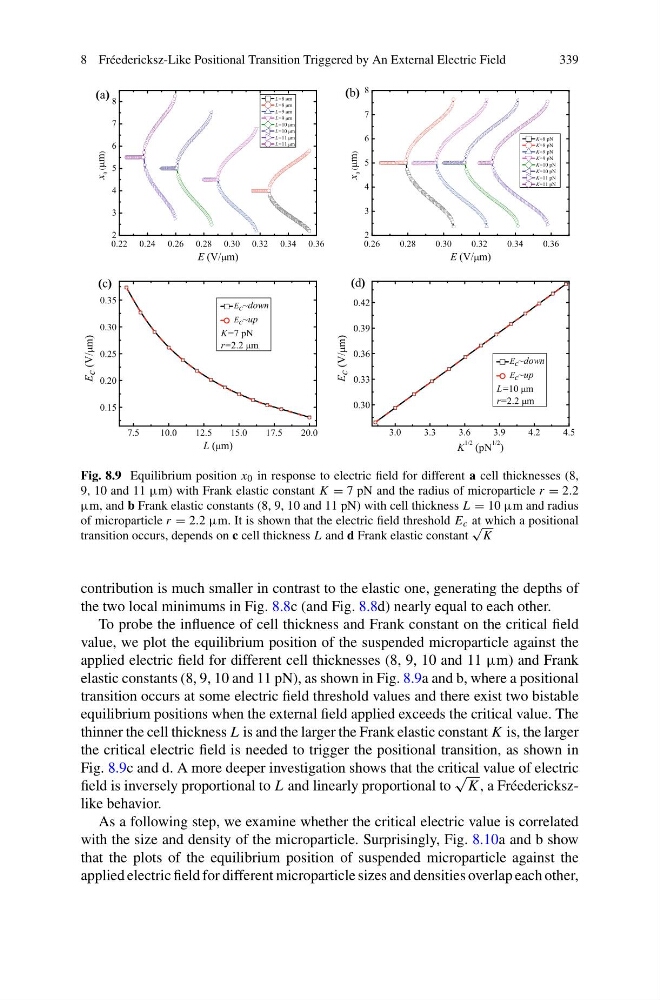
Fig. 8.9 Equilibrium position x 0 in response to electric field for different a cell thicknesses (8,
9, 10 and 11 µm) with Frank elastic constant K = 7 pN and the radius of microparticle r = 2.2
µm, and b Frank elastic constants (8, 9, 10 and 11 pN) with cell thickness L = 10 µm and radius
of microparticle r = 2.2 µm. It is shown that the electric field threshold E c at which a positional
transition occurs, depends on c cell thickness L and d Frank elastic constant
√
K
contribution is much smaller in contrast to the elastic one, generating the depths of
the two local minimums in Fig. 8.8c (and Fig. 8.8d) nearly equal to each other.
To probe the influence of cell thickness and Frank constant on the critical field
value, we plot the equilibrium position of the suspended microparticle against the
applied electric field for different cell thicknesses (8, 9, 10 and 11 µm) and Frank
elastic constants (8, 9, 10 and 11 pN), as shown in Fig. 8.9a and b, where a positional
transition occurs at some electric field threshold values and there exist two bistable
equilibrium positions when the external field applied exceeds the critical value. The
thinner the cell thickness L is and the larger the Frank elastic constant K is, the larger
the critical electric field is needed to trigger the positional transition, as shown in
Fig. 8.9c and d. A more deeper investigation shows that the critical value of electric
field is inversely proportional to L and linearly proportional to
√
K , a Fréederickszlike behavior.
As a following step, we examine whether the critical electric value is correlated
with the size and density of the microparticle. Surprisingly, Fig. 8.10a and b show
that the plots of the equilibrium position of suspended microparticle against the
applied electric field for different microparticle sizes and densities overlap each other,
339
Fig. 8.9 Equilibrium position x 0 in response to electric field for different a cell thicknesses (8,
9, 10 and 11 µm) with Frank elastic constant K = 7 pN and the radius of microparticle r = 2.2
µm, and b Frank elastic constants (8, 9, 10 and 11 pN) with cell thickness L = 10 µm and radius
of microparticle r = 2.2 µm. It is shown that the electric field threshold E c at which a positional
transition occurs, depends on c cell thickness L and d Frank elastic constant
√
K
contribution is much smaller in contrast to the elastic one, generating the depths of
the two local minimums in Fig. 8.8c (and Fig. 8.8d) nearly equal to each other.
To probe the influence of cell thickness and Frank constant on the critical field
value, we plot the equilibrium position of the suspended microparticle against the
applied electric field for different cell thicknesses (8, 9, 10 and 11 µm) and Frank
elastic constants (8, 9, 10 and 11 pN), as shown in Fig. 8.9a and b, where a positional
transition occurs at some electric field threshold values and there exist two bistable
equilibrium positions when the external field applied exceeds the critical value. The
thinner the cell thickness L is and the larger the Frank elastic constant K is, the larger
the critical electric field is needed to trigger the positional transition, as shown in
Fig. 8.9c and d. A more deeper investigation shows that the critical value of electric
field is inversely proportional to L and linearly proportional to
√
K , a Fréederickszlike behavior.
As a following step, we examine whether the critical electric value is correlated
with the size and density of the microparticle. Surprisingly, Fig. 8.10a and b show
that the plots of the equilibrium position of suspended microparticle against the
applied electric field for different microparticle sizes and densities overlap each other,