

3.1 The Nature of Lip Vibration
69
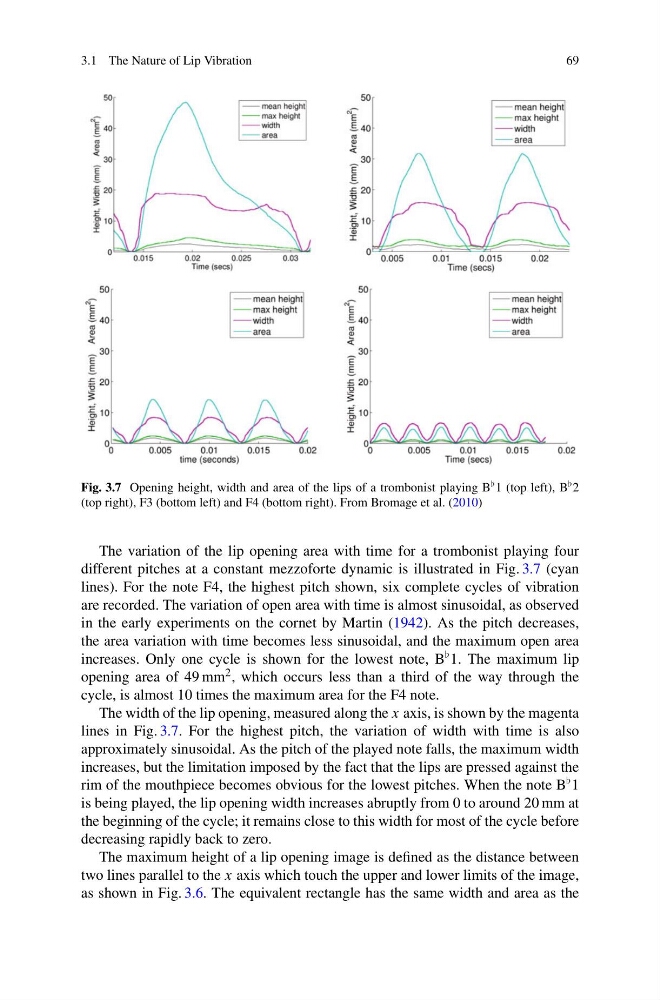
Fig. 3.7 Opening height, width and area of the lips of a trombonist playing B 1 (top left), B 2
(top right), F3 (bottom left) and F4 (bottom right). From Bromage et al. (2010)
The variation of the lip opening area with time for a trombonist playing four
different pitches at a constant mezzoforte dynamic is illustrated in Fig. 3.7 (cyan
lines). For the note F4, the highest pitch shown, six complete cycles of vibration
are recorded. The variation of open area with time is almost sinusoidal, as observed
in the early experiments on the cornet by Martin (1942). As the pitch decreases,
the area variation with time becomes less sinusoidal, and the maximum open area
increases. Only one cycle is shown for the lowest note, B 1. The maximum lip
opening area of 49 mm 2 , which occurs less than a third of the way through the
cycle, is almost 10 times the maximum area for the F4 note.
The width of the lip opening, measured along the x axis, is shown by the magenta
lines in Fig. 3.7. For the highest pitch, the variation of width with time is also
approximately sinusoidal. As the pitch of the played note falls, the maximum width
increases, but the limitation imposed by the fact that the lips are pressed against the
rim of the mouthpiece becomes obvious for the lowest pitches. When the note B 1
is being played, the lip opening width increases abruptly from 0 to around 20 mm at
the beginning of the cycle; it remains close to this width for most of the cycle before
decreasing rapidly back to zero.
The maximum height of a lip opening image is defined as the distance between
two lines parallel to the x axis which touch the upper and lower limits of the image,
as shown in Fig. 3.6. The equivalent rectangle has the same width and area as the
69
Fig. 3.7 Opening height, width and area of the lips of a trombonist playing B 1 (top left), B 2
(top right), F3 (bottom left) and F4 (bottom right). From Bromage et al. (2010)
The variation of the lip opening area with time for a trombonist playing four
different pitches at a constant mezzoforte dynamic is illustrated in Fig. 3.7 (cyan
lines). For the note F4, the highest pitch shown, six complete cycles of vibration
are recorded. The variation of open area with time is almost sinusoidal, as observed
in the early experiments on the cornet by Martin (1942). As the pitch decreases,
the area variation with time becomes less sinusoidal, and the maximum open area
increases. Only one cycle is shown for the lowest note, B 1. The maximum lip
opening area of 49 mm 2 , which occurs less than a third of the way through the
cycle, is almost 10 times the maximum area for the F4 note.
The width of the lip opening, measured along the x axis, is shown by the magenta
lines in Fig. 3.7. For the highest pitch, the variation of width with time is also
approximately sinusoidal. As the pitch of the played note falls, the maximum width
increases, but the limitation imposed by the fact that the lips are pressed against the
rim of the mouthpiece becomes obvious for the lowest pitches. When the note B 1
is being played, the lip opening width increases abruptly from 0 to around 20 mm at
the beginning of the cycle; it remains close to this width for most of the cycle before
decreasing rapidly back to zero.
The maximum height of a lip opening image is defined as the distance between
two lines parallel to the x axis which touch the upper and lower limits of the image,
as shown in Fig. 3.6. The equivalent rectangle has the same width and area as the