

6.3 The Player’s Windway
297
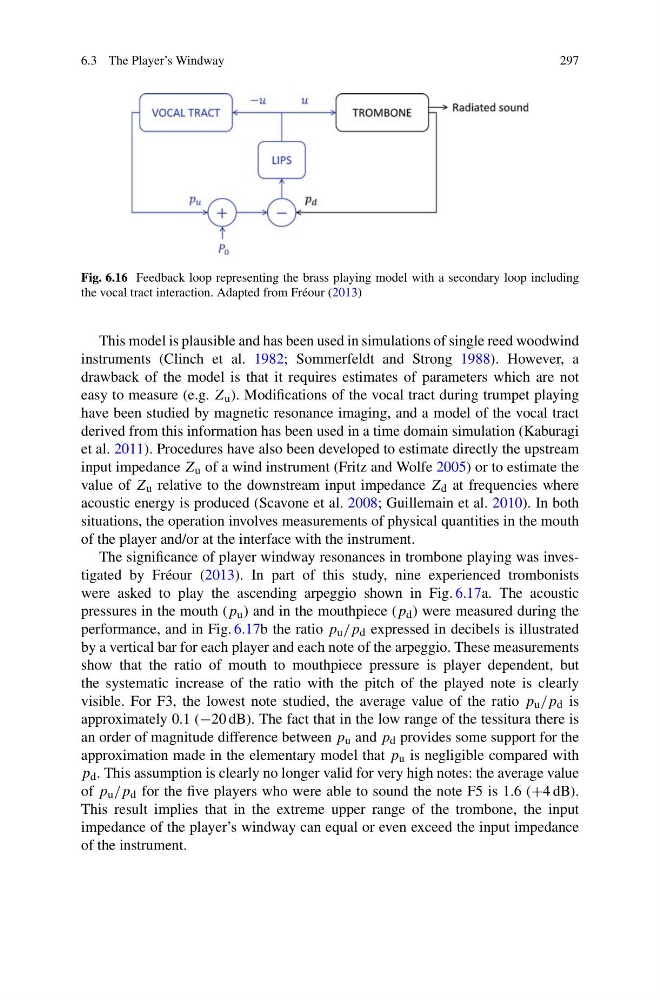
Fig. 6.16 Feedback loop representing the brass playing model with a secondary loop including
the vocal tract interaction. Adapted from Fréour (2013)
This model is plausible and has been used in simulations of single reed woodwind
instruments (Clinch et al. 1982; Sommerfeldt and Strong 1988). However, a
drawback of the model is that it requires estimates of parameters which are not
easy to measure (e.g. Z u ). Modifications of the vocal tract during trumpet playing
have been studied by magnetic resonance imaging, and a model of the vocal tract
derived from this information has been used in a time domain simulation (Kaburagi
et al. 2011). Procedures have also been developed to estimate directly the upstream
input impedance Z u of a wind instrument (Fritz and Wolfe 2005) or to estimate the
value of Z u relative to the downstream input impedance Z d at frequencies where
acoustic energy is produced (Scavone et al. 2008; Guillemain et al. 2010). In both
situations, the operation involves measurements of physical quantities in the mouth
of the player and/or at the interface with the instrument.
The significance of player windway resonances in trombone playing was investigated by Fréour (2013). In part of this study, nine experienced trombonists
were asked to play the ascending arpeggio shown in Fig. 6.17a. The acoustic
pressures in the mouth (p u ) and in the mouthpiece (p d ) were measured during the
performance, and in Fig. 6.17b the ratio p u /p d expressed in decibels is illustrated
by a vertical bar for each player and each note of the arpeggio. These measurements
show that the ratio of mouth to mouthpiece pressure is player dependent, but
the systematic increase of the ratio with the pitch of the played note is clearly
visible. For F3, the lowest note studied, the average value of the ratio p u /p d is
approximately 0.1 (−20 dB). The fact that in the low range of the tessitura there is
an order of magnitude difference between p u and p d provides some support for the
approximation made in the elementary model that p u is negligible compared with
p d . This assumption is clearly no longer valid for very high notes: the average value
of p u /p d for the five players who were able to sound the note F5 is 1.6 (+4 dB).
This result implies that in the extreme upper range of the trombone, the input
impedance of the player’s windway can equal or even exceed the input impedance
of the instrument.
297
Fig. 6.16 Feedback loop representing the brass playing model with a secondary loop including
the vocal tract interaction. Adapted from Fréour (2013)
This model is plausible and has been used in simulations of single reed woodwind
instruments (Clinch et al. 1982; Sommerfeldt and Strong 1988). However, a
drawback of the model is that it requires estimates of parameters which are not
easy to measure (e.g. Z u ). Modifications of the vocal tract during trumpet playing
have been studied by magnetic resonance imaging, and a model of the vocal tract
derived from this information has been used in a time domain simulation (Kaburagi
et al. 2011). Procedures have also been developed to estimate directly the upstream
input impedance Z u of a wind instrument (Fritz and Wolfe 2005) or to estimate the
value of Z u relative to the downstream input impedance Z d at frequencies where
acoustic energy is produced (Scavone et al. 2008; Guillemain et al. 2010). In both
situations, the operation involves measurements of physical quantities in the mouth
of the player and/or at the interface with the instrument.
The significance of player windway resonances in trombone playing was investigated by Fréour (2013). In part of this study, nine experienced trombonists
were asked to play the ascending arpeggio shown in Fig. 6.17a. The acoustic
pressures in the mouth (p u ) and in the mouthpiece (p d ) were measured during the
performance, and in Fig. 6.17b the ratio p u /p d expressed in decibels is illustrated
by a vertical bar for each player and each note of the arpeggio. These measurements
show that the ratio of mouth to mouthpiece pressure is player dependent, but
the systematic increase of the ratio with the pitch of the played note is clearly
visible. For F3, the lowest note studied, the average value of the ratio p u /p d is
approximately 0.1 (−20 dB). The fact that in the low range of the tessitura there is
an order of magnitude difference between p u and p d provides some support for the
approximation made in the elementary model that p u is negligible compared with
p d . This assumption is clearly no longer valid for very high notes: the average value
of p u /p d for the five players who were able to sound the note F5 is 1.6 (+4 dB).
This result implies that in the extreme upper range of the trombone, the input
impedance of the player’s windway can equal or even exceed the input impedance
of the instrument.