

278
6 Shocks and Surprises: Refining the Elementary Model
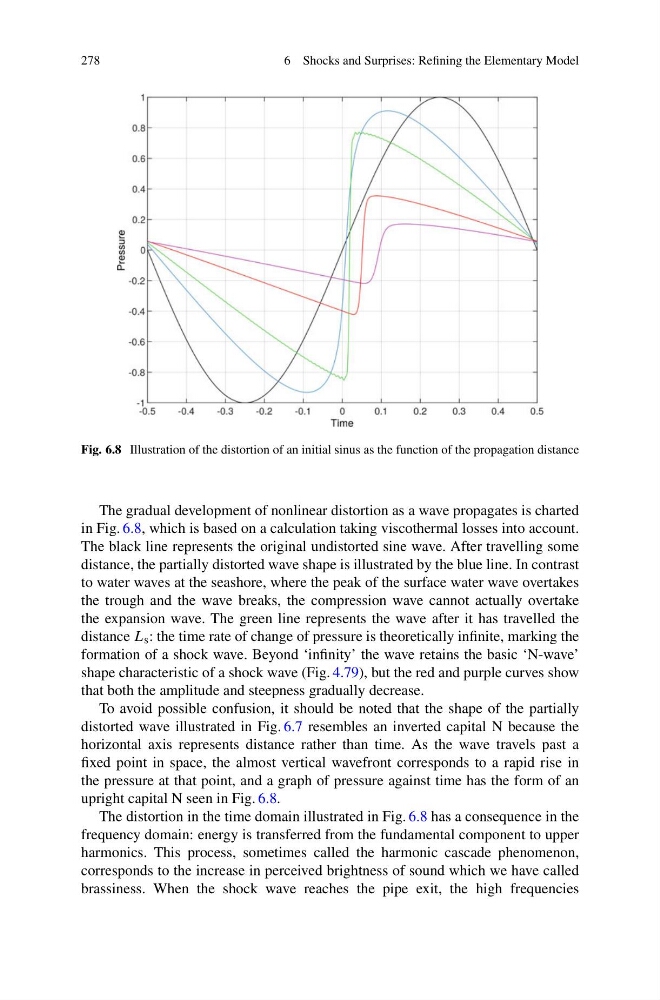
Fig. 6.8 Illustration of the distortion of an initial sinus as the function of the propagation distance
The gradual development of nonlinear distortion as a wave propagates is charted
in Fig. 6.8, which is based on a calculation taking viscothermal losses into account.
The black line represents the original undistorted sine wave. After travelling some
distance, the partially distorted wave shape is illustrated by the blue line. In contrast
to water waves at the seashore, where the peak of the surface water wave overtakes
the trough and the wave breaks, the compression wave cannot actually overtake
the expansion wave. The green line represents the wave after it has travelled the
distance L s : the time rate of change of pressure is theoretically infinite, marking the
formation of a shock wave. Beyond ‘infinity’ the wave retains the basic ‘N-wave’
shape characteristic of a shock wave (Fig. 4.79), but the red and purple curves show
that both the amplitude and steepness gradually decrease.
To avoid possible confusion, it should be noted that the shape of the partially
distorted wave illustrated in Fig. 6.7 resembles an inverted capital N because the
horizontal axis represents distance rather than time. As the wave travels past a
fixed point in space, the almost vertical wavefront corresponds to a rapid rise in
the pressure at that point, and a graph of pressure against time has the form of an
upright capital N seen in Fig. 6.8.
The distortion in the time domain illustrated in Fig. 6.8 has a consequence in the
frequency domain: energy is transferred from the fundamental component to upper
harmonics. This process, sometimes called the harmonic cascade phenomenon,
corresponds to the increase in perceived brightness of sound which we have called
brassiness. When the shock wave reaches the pipe exit, the high frequencies
6 Shocks and Surprises: Refining the Elementary Model
Fig. 6.8 Illustration of the distortion of an initial sinus as the function of the propagation distance
The gradual development of nonlinear distortion as a wave propagates is charted
in Fig. 6.8, which is based on a calculation taking viscothermal losses into account.
The black line represents the original undistorted sine wave. After travelling some
distance, the partially distorted wave shape is illustrated by the blue line. In contrast
to water waves at the seashore, where the peak of the surface water wave overtakes
the trough and the wave breaks, the compression wave cannot actually overtake
the expansion wave. The green line represents the wave after it has travelled the
distance L s : the time rate of change of pressure is theoretically infinite, marking the
formation of a shock wave. Beyond ‘infinity’ the wave retains the basic ‘N-wave’
shape characteristic of a shock wave (Fig. 4.79), but the red and purple curves show
that both the amplitude and steepness gradually decrease.
To avoid possible confusion, it should be noted that the shape of the partially
distorted wave illustrated in Fig. 6.7 resembles an inverted capital N because the
horizontal axis represents distance rather than time. As the wave travels past a
fixed point in space, the almost vertical wavefront corresponds to a rapid rise in
the pressure at that point, and a graph of pressure against time has the form of an
upright capital N seen in Fig. 6.8.
The distortion in the time domain illustrated in Fig. 6.8 has a consequence in the
frequency domain: energy is transferred from the fundamental component to upper
harmonics. This process, sometimes called the harmonic cascade phenomenon,
corresponds to the increase in perceived brightness of sound which we have called
brassiness. When the shock wave reaches the pipe exit, the high frequencies