

5.4 Going Further: From Linear Stability Analysis to Oscillation Regimes
245
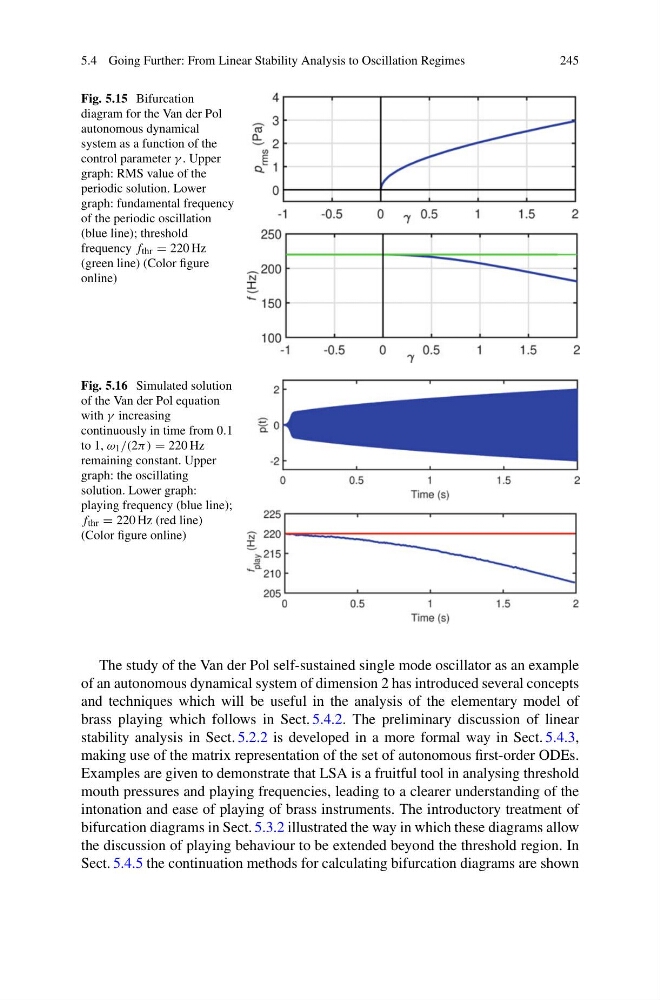
Fig. 5.15 Bifurcation
diagram for the Van der Pol
autonomous dynamical
system as a function of the
control parameter γ . Upper
graph: RMS value of the
periodic solution. Lower
graph: fundamental frequency
of the periodic oscillation
(blue line); threshold
frequency f thr = 220 Hz
(green line) (Color figure
online)
Fig. 5.16 Simulated solution
of the Van der Pol equation
with γ increasing
continuously in time from 0.1
to 1, ω 1 /(2π) = 220 Hz
remaining constant. Upper
graph: the oscillating
solution. Lower graph:
playing frequency (blue line);
f thr = 220 Hz (red line)
(Color figure online)
The study of the Van der Pol self-sustained single mode oscillator as an example
of an autonomous dynamical system of dimension 2 has introduced several concepts
and techniques which will be useful in the analysis of the elementary model of
brass playing which follows in Sect. 5.4.2. The preliminary discussion of linear
stability analysis in Sect. 5.2.2 is developed in a more formal way in Sect. 5.4.3,
making use of the matrix representation of the set of autonomous first-order ODEs.
Examples are given to demonstrate that LSA is a fruitful tool in analysing threshold
mouth pressures and playing frequencies, leading to a clearer understanding of the
intonation and ease of playing of brass instruments. The introductory treatment of
bifurcation diagrams in Sect. 5.3.2 illustrated the way in which these diagrams allow
the discussion of playing behaviour to be extended beyond the threshold region. In
Sect. 5.4.5 the continuation methods for calculating bifurcation diagrams are shown
245
Fig. 5.15 Bifurcation
diagram for the Van der Pol
autonomous dynamical
system as a function of the
control parameter γ . Upper
graph: RMS value of the
periodic solution. Lower
graph: fundamental frequency
of the periodic oscillation
(blue line); threshold
frequency f thr = 220 Hz
(green line) (Color figure
online)
Fig. 5.16 Simulated solution
of the Van der Pol equation
with γ increasing
continuously in time from 0.1
to 1, ω 1 /(2π) = 220 Hz
remaining constant. Upper
graph: the oscillating
solution. Lower graph:
playing frequency (blue line);
f thr = 220 Hz (red line)
(Color figure online)
The study of the Van der Pol self-sustained single mode oscillator as an example
of an autonomous dynamical system of dimension 2 has introduced several concepts
and techniques which will be useful in the analysis of the elementary model of
brass playing which follows in Sect. 5.4.2. The preliminary discussion of linear
stability analysis in Sect. 5.2.2 is developed in a more formal way in Sect. 5.4.3,
making use of the matrix representation of the set of autonomous first-order ODEs.
Examples are given to demonstrate that LSA is a fruitful tool in analysing threshold
mouth pressures and playing frequencies, leading to a clearer understanding of the
intonation and ease of playing of brass instruments. The introductory treatment of
bifurcation diagrams in Sect. 5.3.2 illustrated the way in which these diagrams allow
the discussion of playing behaviour to be extended beyond the threshold region. In
Sect. 5.4.5 the continuation methods for calculating bifurcation diagrams are shown