

5.2 Crossing the Threshold: Small Amplitude Oscillating Solutions
231
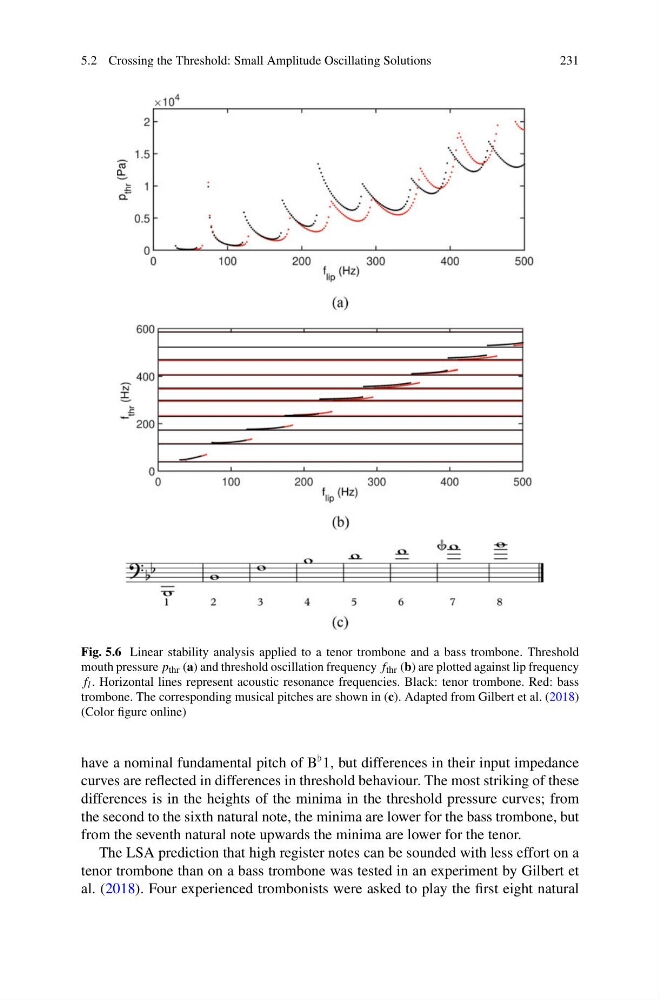
Fig. 5.6 Linear stability analysis applied to a tenor trombone and a bass trombone. Threshold
mouth pressure p thr (a) and threshold oscillation frequency f thr (b) are plotted against lip frequency
f l . Horizontal lines represent acoustic resonance frequencies. Black: tenor trombone. Red: bass
trombone. The corresponding musical pitches are shown in (c). Adapted from Gilbert et al. (2018)
(Color figure online)
have a nominal fundamental pitch of B 1, but differences in their input impedance
curves are reflected in differences in threshold behaviour. The most striking of these
differences is in the heights of the minima in the threshold pressure curves; from
the second to the sixth natural note, the minima are lower for the bass trombone, but
from the seventh natural note upwards the minima are lower for the tenor.
The LSA prediction that high register notes can be sounded with less effort on a
tenor trombone than on a bass trombone was tested in an experiment by Gilbert et
al. (2018). Four experienced trombonists were asked to play the first eight natural
231
Fig. 5.6 Linear stability analysis applied to a tenor trombone and a bass trombone. Threshold
mouth pressure p thr (a) and threshold oscillation frequency f thr (b) are plotted against lip frequency
f l . Horizontal lines represent acoustic resonance frequencies. Black: tenor trombone. Red: bass
trombone. The corresponding musical pitches are shown in (c). Adapted from Gilbert et al. (2018)
(Color figure online)
have a nominal fundamental pitch of B 1, but differences in their input impedance
curves are reflected in differences in threshold behaviour. The most striking of these
differences is in the heights of the minima in the threshold pressure curves; from
the second to the sixth natural note, the minima are lower for the bass trombone, but
from the seventh natural note upwards the minima are lower for the tenor.
The LSA prediction that high register notes can be sounded with less effort on a
tenor trombone than on a bass trombone was tested in an experiment by Gilbert et
al. (2018). Four experienced trombonists were asked to play the first eight natural