

192
4 After the Lips: Acoustic Resonances and Radiation
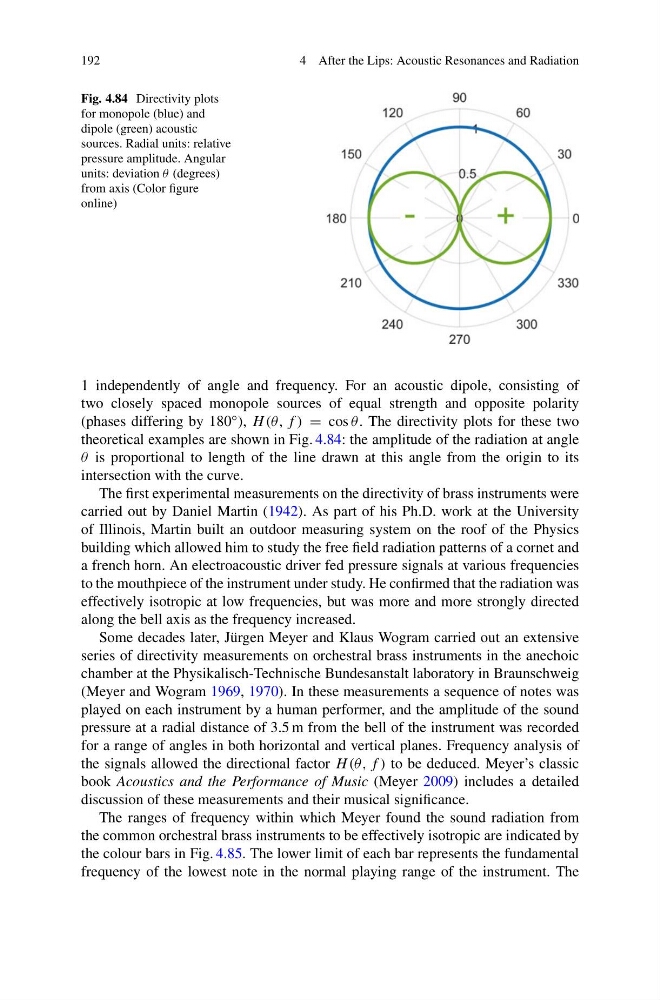
Fig. 4.84 Directivity plots
for monopole (blue) and
dipole (green) acoustic
sources. Radial units: relative
pressure amplitude. Angular
units: deviation θ (degrees)
from axis (Color figure
online)
1 independently of angle and frequency. For an acoustic dipole, consisting of
two closely spaced monopole sources of equal strength and opposite polarity
(phases differing by 180 ◦ ), H (θ, f ) = cos θ . The directivity plots for these two
theoretical examples are shown in Fig. 4.84: the amplitude of the radiation at angle
θ is proportional to length of the line drawn at this angle from the origin to its
intersection with the curve.
The first experimental measurements on the directivity of brass instruments were
carried out by Daniel Martin (1942). As part of his Ph.D. work at the University
of Illinois, Martin built an outdoor measuring system on the roof of the Physics
building which allowed him to study the free field radiation patterns of a cornet and
a french horn. An electroacoustic driver fed pressure signals at various frequencies
to the mouthpiece of the instrument under study. He confirmed that the radiation was
effectively isotropic at low frequencies, but was more and more strongly directed
along the bell axis as the frequency increased.
Some decades later, Jürgen Meyer and Klaus Wogram carried out an extensive
series of directivity measurements on orchestral brass instruments in the anechoic
chamber at the Physikalisch-Technische Bundesanstalt laboratory in Braunschweig
(Meyer and Wogram 1969, 1970). In these measurements a sequence of notes was
played on each instrument by a human performer, and the amplitude of the sound
pressure at a radial distance of 3.5 m from the bell of the instrument was recorded
for a range of angles in both horizontal and vertical planes. Frequency analysis of
the signals allowed the directional factor H (θ, f ) to be deduced. Meyer’s classic
book Acoustics and the Performance of Music (Meyer 2009) includes a detailed
discussion of these measurements and their musical significance.
The ranges of frequency within which Meyer found the sound radiation from
the common orchestral brass instruments to be effectively isotropic are indicated by
the colour bars in Fig. 4.85. The lower limit of each bar represents the fundamental
frequency of the lowest note in the normal playing range of the instrument. The
4 After the Lips: Acoustic Resonances and Radiation
Fig. 4.84 Directivity plots
for monopole (blue) and
dipole (green) acoustic
sources. Radial units: relative
pressure amplitude. Angular
units: deviation θ (degrees)
from axis (Color figure
online)
1 independently of angle and frequency. For an acoustic dipole, consisting of
two closely spaced monopole sources of equal strength and opposite polarity
(phases differing by 180 ◦ ), H (θ, f ) = cos θ . The directivity plots for these two
theoretical examples are shown in Fig. 4.84: the amplitude of the radiation at angle
θ is proportional to length of the line drawn at this angle from the origin to its
intersection with the curve.
The first experimental measurements on the directivity of brass instruments were
carried out by Daniel Martin (1942). As part of his Ph.D. work at the University
of Illinois, Martin built an outdoor measuring system on the roof of the Physics
building which allowed him to study the free field radiation patterns of a cornet and
a french horn. An electroacoustic driver fed pressure signals at various frequencies
to the mouthpiece of the instrument under study. He confirmed that the radiation was
effectively isotropic at low frequencies, but was more and more strongly directed
along the bell axis as the frequency increased.
Some decades later, Jürgen Meyer and Klaus Wogram carried out an extensive
series of directivity measurements on orchestral brass instruments in the anechoic
chamber at the Physikalisch-Technische Bundesanstalt laboratory in Braunschweig
(Meyer and Wogram 1969, 1970). In these measurements a sequence of notes was
played on each instrument by a human performer, and the amplitude of the sound
pressure at a radial distance of 3.5 m from the bell of the instrument was recorded
for a range of angles in both horizontal and vertical planes. Frequency analysis of
the signals allowed the directional factor H (θ, f ) to be deduced. Meyer’s classic
book Acoustics and the Performance of Music (Meyer 2009) includes a detailed
discussion of these measurements and their musical significance.
The ranges of frequency within which Meyer found the sound radiation from
the common orchestral brass instruments to be effectively isotropic are indicated by
the colour bars in Fig. 4.85. The lower limit of each bar represents the fundamental
frequency of the lowest note in the normal playing range of the instrument. The