

4.5 Mutes
169
far below this and causes no disruption. However the parasite has a more poisonous
influence when the slide is fully extended, as shown in Fig. 4.63b. This is the
position used to sound the note E2, at a frequency of 82.4 Hz. The parasitic peak
frequency is now so close to this frequency that it splits the second main peak into
two sub-peaks at 70 and 86 Hz. As a consequence the note E2 is unstable when
played with the straight mute inserted.
The precise pitch at which the parasitic peak appears depends on the detailed
profiles of the instrument bell and the mute. A novel design of trombone mute which
uses active control technology to suppress the parasitic resonance is described in
Sect. 9.2.2.
Several higher-frequency minima can also be seen in the mute impedance curve
in Fig. 4.62. Each minimum corresponds to a standing wave inside the mute with a
pressure antinode at the closed end and a pressure node at the open end. Near these
frequencies the mute is more efficient at trapping and reflecting the sound energy
arriving in the bell region, and the fraction of sound energy radiated externally is
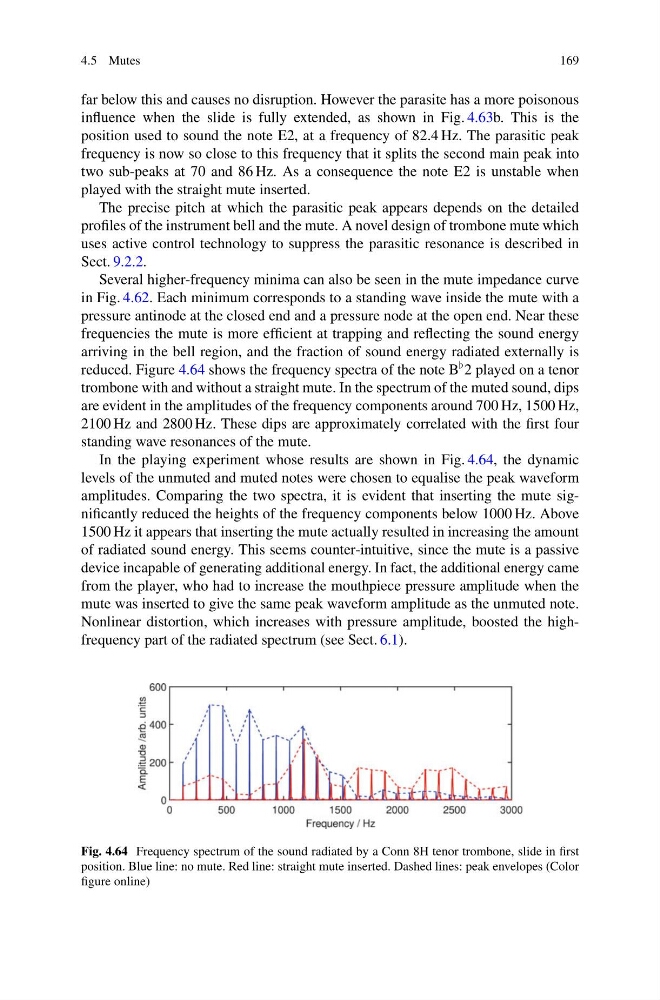
reduced. Figure 4.64 shows the frequency spectra of the note B 2 played on a tenor
trombone with and without a straight mute. In the spectrum of the muted sound, dips
are evident in the amplitudes of the frequency components around 700 Hz, 1500 Hz,
2100 Hz and 2800 Hz. These dips are approximately correlated with the first four
standing wave resonances of the mute.
In the playing experiment whose results are shown in Fig. 4.64, the dynamic
levels of the unmuted and muted notes were chosen to equalise the peak waveform
amplitudes. Comparing the two spectra, it is evident that inserting the mute significantly reduced the heights of the frequency components below 1000 Hz. Above
1500 Hz it appears that inserting the mute actually resulted in increasing the amount
of radiated sound energy. This seems counter-intuitive, since the mute is a passive
device incapable of generating additional energy. In fact, the additional energy came
from the player, who had to increase the mouthpiece pressure amplitude when the
mute was inserted to give the same peak waveform amplitude as the unmuted note.
Nonlinear distortion, which increases with pressure amplitude, boosted the highfrequency part of the radiated spectrum (see Sect. 6.1).
Fig. 4.64 Frequency spectrum of the sound radiated by a Conn 8H tenor trombone, slide in first
position. Blue line: no mute. Red line: straight mute inserted. Dashed lines: peak envelopes (Color
figure online)
169
far below this and causes no disruption. However the parasite has a more poisonous
influence when the slide is fully extended, as shown in Fig. 4.63b. This is the
position used to sound the note E2, at a frequency of 82.4 Hz. The parasitic peak
frequency is now so close to this frequency that it splits the second main peak into
two sub-peaks at 70 and 86 Hz. As a consequence the note E2 is unstable when
played with the straight mute inserted.
The precise pitch at which the parasitic peak appears depends on the detailed
profiles of the instrument bell and the mute. A novel design of trombone mute which
uses active control technology to suppress the parasitic resonance is described in
Sect. 9.2.2.
Several higher-frequency minima can also be seen in the mute impedance curve
in Fig. 4.62. Each minimum corresponds to a standing wave inside the mute with a
pressure antinode at the closed end and a pressure node at the open end. Near these
frequencies the mute is more efficient at trapping and reflecting the sound energy
arriving in the bell region, and the fraction of sound energy radiated externally is
reduced. Figure 4.64 shows the frequency spectra of the note B 2 played on a tenor
trombone with and without a straight mute. In the spectrum of the muted sound, dips
are evident in the amplitudes of the frequency components around 700 Hz, 1500 Hz,
2100 Hz and 2800 Hz. These dips are approximately correlated with the first four
standing wave resonances of the mute.
In the playing experiment whose results are shown in Fig. 4.64, the dynamic
levels of the unmuted and muted notes were chosen to equalise the peak waveform
amplitudes. Comparing the two spectra, it is evident that inserting the mute significantly reduced the heights of the frequency components below 1000 Hz. Above
1500 Hz it appears that inserting the mute actually resulted in increasing the amount
of radiated sound energy. This seems counter-intuitive, since the mute is a passive
device incapable of generating additional energy. In fact, the additional energy came
from the player, who had to increase the mouthpiece pressure amplitude when the
mute was inserted to give the same peak waveform amplitude as the unmuted note.
Nonlinear distortion, which increases with pressure amplitude, boosted the highfrequency part of the radiated spectrum (see Sect. 6.1).
Fig. 4.64 Frequency spectrum of the sound radiated by a Conn 8H tenor trombone, slide in first
position. Blue line: no mute. Red line: straight mute inserted. Dashed lines: peak envelopes (Color
figure online)