

4.5 Mutes
167
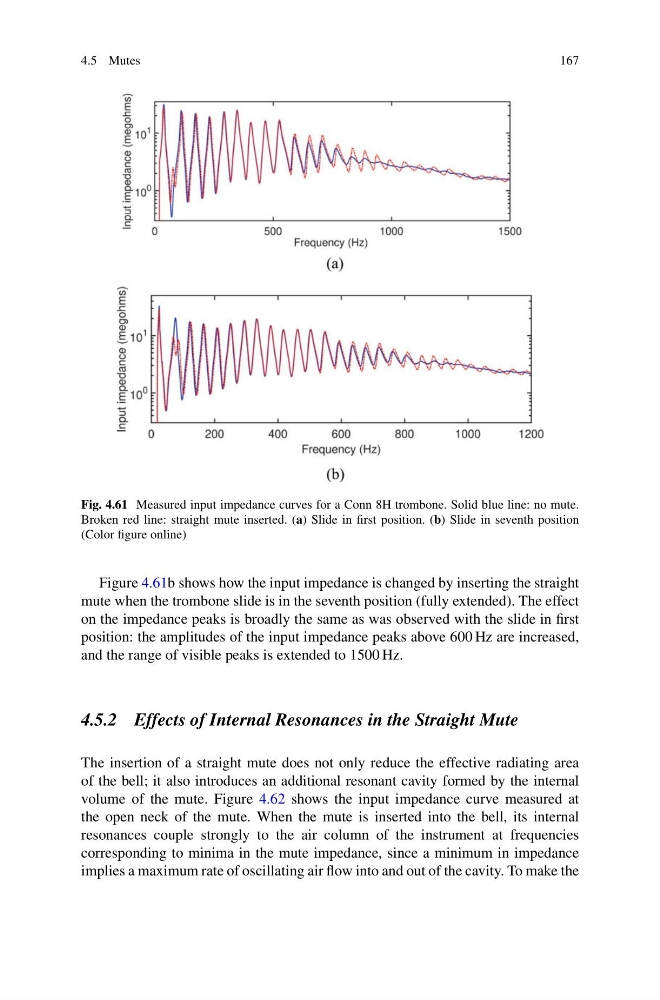
Fig. 4.61 Measured input impedance curves for a Conn 8H trombone. Solid blue line: no mute.
Broken red line: straight mute inserted. (a) Slide in first position. (b) Slide in seventh position
(Color figure online)
Figure 4.61b shows how the input impedance is changed by inserting the straight
mute when the trombone slide is in the seventh position (fully extended). The effect
on the impedance peaks is broadly the same as was observed with the slide in first
position: the amplitudes of the input impedance peaks above 600 Hz are increased,
and the range of visible peaks is extended to 1500 Hz.
4.5.2 Effects of Internal Resonances in the Straight Mute
The insertion of a straight mute does not only reduce the effective radiating area
of the bell; it also introduces an additional resonant cavity formed by the internal
volume of the mute. Figure 4.62 shows the input impedance curve measured at
the open neck of the mute. When the mute is inserted into the bell, its internal
resonances couple strongly to the air column of the instrument at frequencies
corresponding to minima in the mute impedance, since a minimum in impedance
implies a maximum rate of oscillating air flow into and out of the cavity. To make the
167
Fig. 4.61 Measured input impedance curves for a Conn 8H trombone. Solid blue line: no mute.
Broken red line: straight mute inserted. (a) Slide in first position. (b) Slide in seventh position
(Color figure online)
Figure 4.61b shows how the input impedance is changed by inserting the straight
mute when the trombone slide is in the seventh position (fully extended). The effect
on the impedance peaks is broadly the same as was observed with the slide in first
position: the amplitudes of the input impedance peaks above 600 Hz are increased,
and the range of visible peaks is extended to 1500 Hz.
4.5.2 Effects of Internal Resonances in the Straight Mute
The insertion of a straight mute does not only reduce the effective radiating area
of the bell; it also introduces an additional resonant cavity formed by the internal
volume of the mute. Figure 4.62 shows the input impedance curve measured at
the open neck of the mute. When the mute is inserted into the bell, its internal
resonances couple strongly to the air column of the instrument at frequencies
corresponding to minima in the mute impedance, since a minimum in impedance
implies a maximum rate of oscillating air flow into and out of the cavity. To make the