

4.3 Bore Profiles of Brass Instruments
137
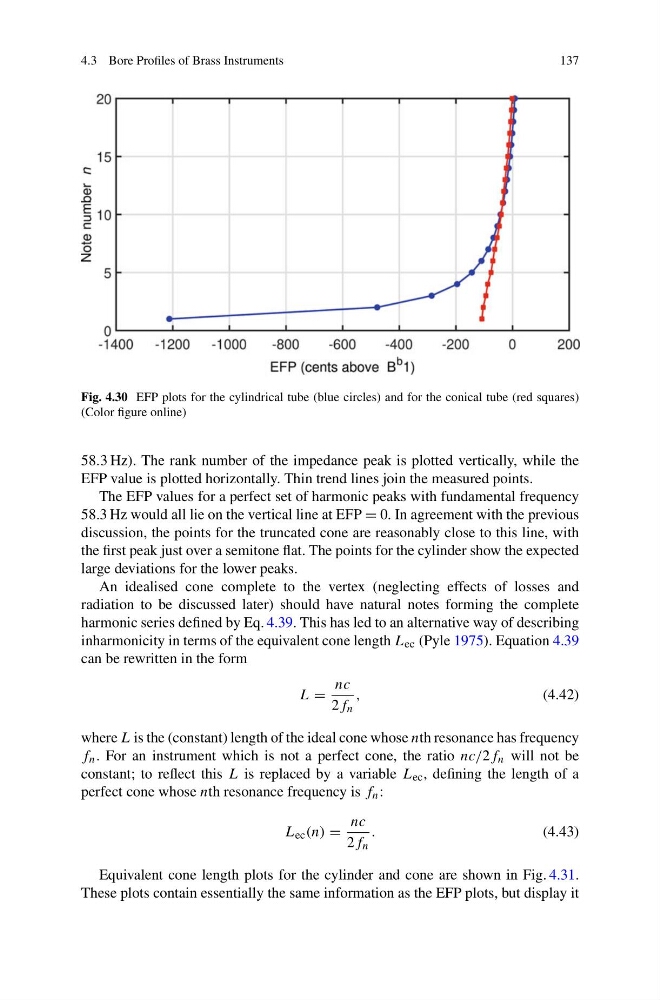
Fig. 4.30 EFP plots for the cylindrical tube (blue circles) and for the conical tube (red squares)
(Color figure online)
58.3 Hz). The rank number of the impedance peak is plotted vertically, while the
EFP value is plotted horizontally. Thin trend lines join the measured points.
The EFP values for a perfect set of harmonic peaks with fundamental frequency
58.3 Hz would all lie on the vertical line at EFP = 0. In agreement with the previous
discussion, the points for the truncated cone are reasonably close to this line, with
the first peak just over a semitone flat. The points for the cylinder show the expected
large deviations for the lower peaks.
An idealised cone complete to the vertex (neglecting effects of losses and
radiation to be discussed later) should have natural notes forming the complete
harmonic series defined by Eq. 4.39. This has led to an alternative way of describing
inharmonicity in terms of the equivalent cone length L ec (Pyle 1975). Equation 4.39
can be rewritten in the form
L =
nc
2f n
,
(4.42)
where L is the (constant) length of the ideal cone whose nth resonance has frequency
f n . For an instrument which is not a perfect cone, the ratio nc/2f n will not be
constant; to reflect this L is replaced by a variable L ec , defining the length of a
perfect cone whose nth resonance frequency is f n :
L ec (n) =
nc
2f n
.
(4.43)
Equivalent cone length plots for the cylinder and cone are shown in Fig. 4.31.
These plots contain essentially the same information as the EFP plots, but display it
137
Fig. 4.30 EFP plots for the cylindrical tube (blue circles) and for the conical tube (red squares)
(Color figure online)
58.3 Hz). The rank number of the impedance peak is plotted vertically, while the
EFP value is plotted horizontally. Thin trend lines join the measured points.
The EFP values for a perfect set of harmonic peaks with fundamental frequency
58.3 Hz would all lie on the vertical line at EFP = 0. In agreement with the previous
discussion, the points for the truncated cone are reasonably close to this line, with
the first peak just over a semitone flat. The points for the cylinder show the expected
large deviations for the lower peaks.
An idealised cone complete to the vertex (neglecting effects of losses and
radiation to be discussed later) should have natural notes forming the complete
harmonic series defined by Eq. 4.39. This has led to an alternative way of describing
inharmonicity in terms of the equivalent cone length L ec (Pyle 1975). Equation 4.39
can be rewritten in the form
L =
nc
2f n
,
(4.42)
where L is the (constant) length of the ideal cone whose nth resonance has frequency
f n . For an instrument which is not a perfect cone, the ratio nc/2f n will not be
constant; to reflect this L is replaced by a variable L ec , defining the length of a
perfect cone whose nth resonance frequency is f n :
L ec (n) =
nc
2f n
.
(4.43)
Equivalent cone length plots for the cylinder and cone are shown in Fig. 4.31.
These plots contain essentially the same information as the EFP plots, but display it