

36
S. Mallik et al.
Fig. 3.7 Same as Fig. 3.6
except the impact parameter
is 3 fm
3.5 Statistical Bimodality
The distribution plotted in Figs. 3.4 and 3.5 can be defined as freeze-out distribution and can still evolve in subsequent time because of secondary decay which has
been calculated by switching over to the Canonical Thermodynamical Model (CTM)
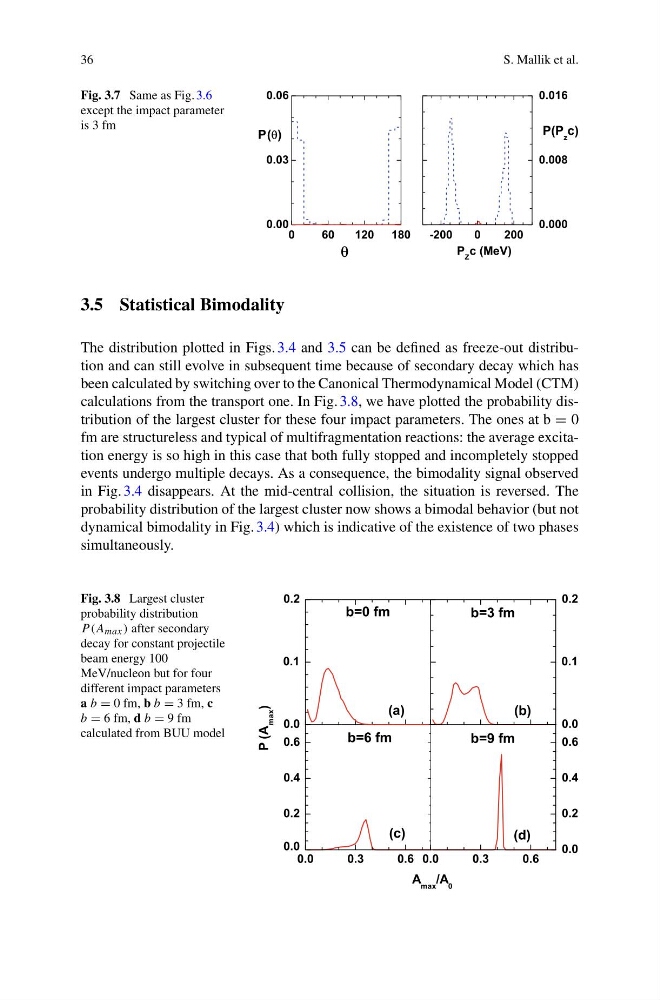
calculations from the transport one. In Fig. 3.8, we have plotted the probability distribution of the largest cluster for these four impact parameters. The ones at b = 0
fm are structureless and typical of multifragmentation reactions: the average excitation energy is so high in this case that both fully stopped and incompletely stopped
events undergo multiple decays. As a consequence, the bimodality signal observed
in Fig. 3.4 disappears. At the mid-central collision, the situation is reversed. The
probability distribution of the largest cluster now shows a bimodal behavior (but not
dynamical bimodality in Fig. 3.4) which is indicative of the existence of two phases
simultaneously.
Fig. 3.8 Largest cluster
probability distribution
P(A max ) after secondary
decay for constant projectile
beam energy 100
MeV/nucleon but for four
different impact parameters
a b = 0 fm, b b = 3 fm, c
b = 6 fm, d b = 9 fm
calculated from BUU model
S. Mallik et al.
Fig. 3.7 Same as Fig. 3.6
except the impact parameter
is 3 fm
3.5 Statistical Bimodality
The distribution plotted in Figs. 3.4 and 3.5 can be defined as freeze-out distribution and can still evolve in subsequent time because of secondary decay which has
been calculated by switching over to the Canonical Thermodynamical Model (CTM)
calculations from the transport one. In Fig. 3.8, we have plotted the probability distribution of the largest cluster for these four impact parameters. The ones at b = 0
fm are structureless and typical of multifragmentation reactions: the average excitation energy is so high in this case that both fully stopped and incompletely stopped
events undergo multiple decays. As a consequence, the bimodality signal observed
in Fig. 3.4 disappears. At the mid-central collision, the situation is reversed. The
probability distribution of the largest cluster now shows a bimodal behavior (but not
dynamical bimodality in Fig. 3.4) which is indicative of the existence of two phases
simultaneously.
Fig. 3.8 Largest cluster
probability distribution
P(A max ) after secondary
decay for constant projectile
beam energy 100
MeV/nucleon but for four
different impact parameters
a b = 0 fm, b b = 3 fm, c
b = 6 fm, d b = 9 fm
calculated from BUU model