

32
S. Mallik et al.
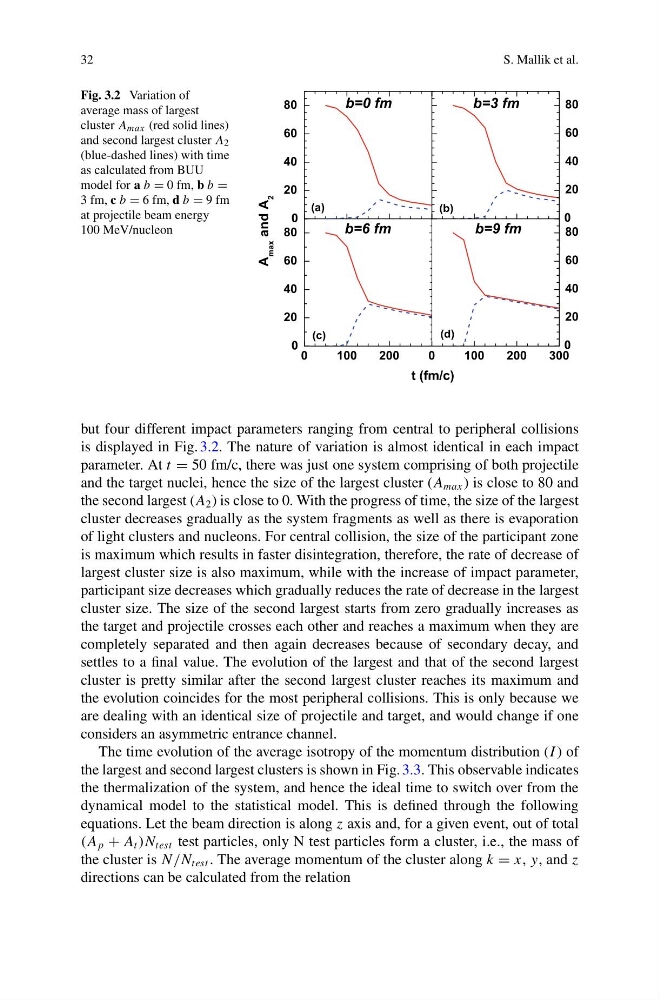
Fig. 3.2 Variation of
average mass of largest
cluster A max (red solid lines)
and second largest cluster A 2
(blue-dashed lines) with time
as calculated from BUU
model for a b = 0 fm, b b =
3 fm, c b = 6 fm, d b = 9 fm
at projectile beam energy
100 MeV/nucleon
but four different impact parameters ranging from central to peripheral collisions
is displayed in Fig. 3.2. The nature of variation is almost identical in each impact
parameter. At t = 50 fm/c, there was just one system comprising of both projectile
and the target nuclei, hence the size of the largest cluster (A max ) is close to 80 and
the second largest (A 2 ) is close to 0. With the progress of time, the size of the largest
cluster decreases gradually as the system fragments as well as there is evaporation
of light clusters and nucleons. For central collision, the size of the participant zone
is maximum which results in faster disintegration, therefore, the rate of decrease of
largest cluster size is also maximum, while with the increase of impact parameter,
participant size decreases which gradually reduces the rate of decrease in the largest
cluster size. The size of the second largest starts from zero gradually increases as
the target and projectile crosses each other and reaches a maximum when they are
completely separated and then again decreases because of secondary decay, and
settles to a final value. The evolution of the largest and that of the second largest
cluster is pretty similar after the second largest cluster reaches its maximum and
the evolution coincides for the most peripheral collisions. This is only because we
are dealing with an identical size of projectile and target, and would change if one
considers an asymmetric entrance channel.
The time evolution of the average isotropy of the momentum distribution (I ) of
the largest and second largest clusters is shown in Fig. 3.3. This observable indicates
the thermalization of the system, and hence the ideal time to switch over from the
dynamical model to the statistical model. This is defined through the following
equations. Let the beam direction is along z axis and, for a given event, out of total
(A p + A t )N test test particles, only N test particles form a cluster, i.e., the mass of
the cluster is N /N test . The average momentum of the cluster along k = x, y, and z
directions can be calculated from the relation
S. Mallik et al.
Fig. 3.2 Variation of
average mass of largest
cluster A max (red solid lines)
and second largest cluster A 2
(blue-dashed lines) with time
as calculated from BUU
model for a b = 0 fm, b b =
3 fm, c b = 6 fm, d b = 9 fm
at projectile beam energy
100 MeV/nucleon
but four different impact parameters ranging from central to peripheral collisions
is displayed in Fig. 3.2. The nature of variation is almost identical in each impact
parameter. At t = 50 fm/c, there was just one system comprising of both projectile
and the target nuclei, hence the size of the largest cluster (A max ) is close to 80 and
the second largest (A 2 ) is close to 0. With the progress of time, the size of the largest
cluster decreases gradually as the system fragments as well as there is evaporation
of light clusters and nucleons. For central collision, the size of the participant zone
is maximum which results in faster disintegration, therefore, the rate of decrease of
largest cluster size is also maximum, while with the increase of impact parameter,
participant size decreases which gradually reduces the rate of decrease in the largest
cluster size. The size of the second largest starts from zero gradually increases as
the target and projectile crosses each other and reaches a maximum when they are
completely separated and then again decreases because of secondary decay, and
settles to a final value. The evolution of the largest and that of the second largest
cluster is pretty similar after the second largest cluster reaches its maximum and
the evolution coincides for the most peripheral collisions. This is only because we
are dealing with an identical size of projectile and target, and would change if one
considers an asymmetric entrance channel.
The time evolution of the average isotropy of the momentum distribution (I ) of
the largest and second largest clusters is shown in Fig. 3.3. This observable indicates
the thermalization of the system, and hence the ideal time to switch over from the
dynamical model to the statistical model. This is defined through the following
equations. Let the beam direction is along z axis and, for a given event, out of total
(A p + A t )N test test particles, only N test particles form a cluster, i.e., the mass of
the cluster is N /N test . The average momentum of the cluster along k = x, y, and z
directions can be calculated from the relation