

270
A. Quddus and S. K. Patra
0
2
4
6
8
r (fm)
0.00
0.04
0.08
0.12
0.16
0.20
ρ (fm
-3
)
NL3
IOPB-I
40 Ca
52
Ca
(a)
2
3
4
5
6
7
8
x (fm)
0.00
0.10
0.20
0.30
0.40
0.50
0.60
| f(x) |
2
NL3
IOPB-I
40
Ca
52
Ca
(b)
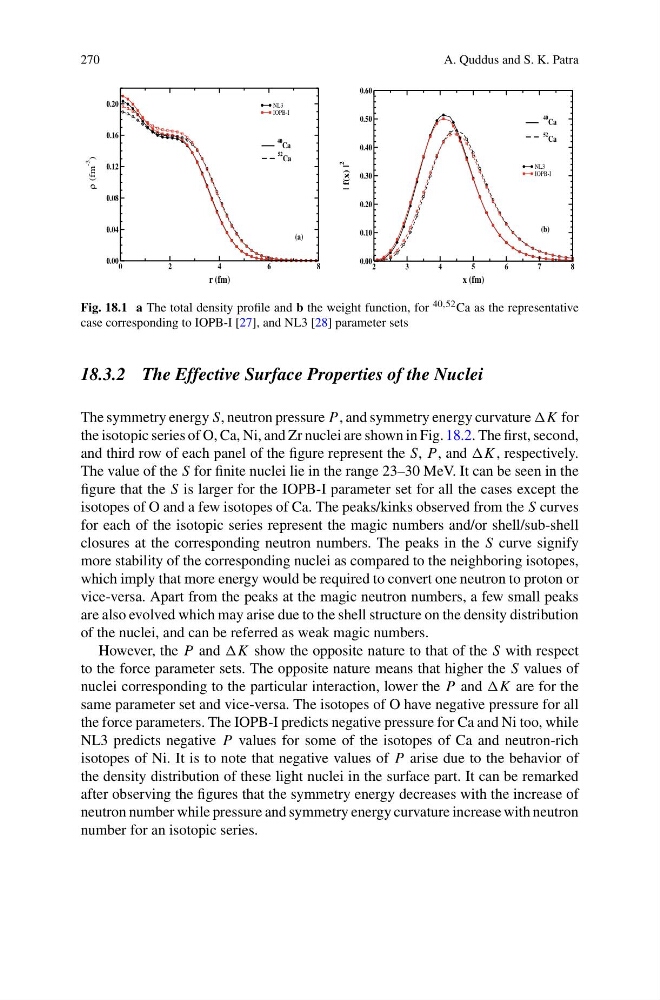
Fig. 18.1 a The total density profile and b the weight function, for 40,52 Ca as the representative
case corresponding to IOPB-I [27], and NL3 [28] parameter sets
18.3.2 The Effective Surface Properties of the Nuclei
The symmetry energy S, neutron pressure P, and symmetry energy curvature for
the isotopic series of O, Ca, Ni, and Zr nuclei are shown in Fig. 18.2. The first, second,
and third row of each panel of the figure represent the S, P, and , respectively.
The value of the S for finite nuclei lie in the range 23–30 MeV. It can be seen in the
figure that the S is larger for the IOPB-I parameter set for all the cases except the
isotopes of O and a few isotopes of Ca. The peaks/kinks observed from the S curves
for each of the isotopic series represent the magic numbers and/or shell/sub-shell
closures at the corresponding neutron numbers. The peaks in the S curve signify
more stability of the corresponding nuclei as compared to the neighboring isotopes,
which imply that more energy would be required to convert one neutron to proton or
vice-versa. Apart from the peaks at the magic neutron numbers, a few small peaks
are also evolved which may arise due to the shell structure on the density distribution
of the nuclei, and can be referred as weak magic numbers.
However, the P and show the opposite nature to that of the S with respect
to the force parameter sets. The opposite nature means that higher the S values of
nuclei corresponding to the particular interaction, lower the P and are for the
same parameter set and vice-versa. The isotopes of O have negative pressure for all
the force parameters. The IOPB-I predicts negative pressure for Ca and Ni too, while
NL3 predicts negative P values for some of the isotopes of Ca and neutron-rich
isotopes of Ni. It is to note that negative values of P arise due to the behavior of
the density distribution of these light nuclei in the surface part. It can be remarked
after observing the figures that the symmetry energy decreases with the increase of
neutron number while pressure and symmetry energy curvature increase with neutron
number for an isotopic series.
A. Quddus and S. K. Patra
0
2
4
6
8
r (fm)
0.00
0.04
0.08
0.12
0.16
0.20
ρ (fm
-3
)
NL3
IOPB-I
40 Ca
52
Ca
(a)
2
3
4
5
6
7
8
x (fm)
0.00
0.10
0.20
0.30
0.40
0.50
0.60
| f(x) |
2
NL3
IOPB-I
40
Ca
52
Ca
(b)
Fig. 18.1 a The total density profile and b the weight function, for 40,52 Ca as the representative
case corresponding to IOPB-I [27], and NL3 [28] parameter sets
18.3.2 The Effective Surface Properties of the Nuclei
The symmetry energy S, neutron pressure P, and symmetry energy curvature for
the isotopic series of O, Ca, Ni, and Zr nuclei are shown in Fig. 18.2. The first, second,
and third row of each panel of the figure represent the S, P, and , respectively.
The value of the S for finite nuclei lie in the range 23–30 MeV. It can be seen in the
figure that the S is larger for the IOPB-I parameter set for all the cases except the
isotopes of O and a few isotopes of Ca. The peaks/kinks observed from the S curves
for each of the isotopic series represent the magic numbers and/or shell/sub-shell
closures at the corresponding neutron numbers. The peaks in the S curve signify
more stability of the corresponding nuclei as compared to the neighboring isotopes,
which imply that more energy would be required to convert one neutron to proton or
vice-versa. Apart from the peaks at the magic neutron numbers, a few small peaks
are also evolved which may arise due to the shell structure on the density distribution
of the nuclei, and can be referred as weak magic numbers.
However, the P and show the opposite nature to that of the S with respect
to the force parameter sets. The opposite nature means that higher the S values of
nuclei corresponding to the particular interaction, lower the P and are for the
same parameter set and vice-versa. The isotopes of O have negative pressure for all
the force parameters. The IOPB-I predicts negative pressure for Ca and Ni too, while
NL3 predicts negative P values for some of the isotopes of Ca and neutron-rich
isotopes of Ni. It is to note that negative values of P arise due to the behavior of
the density distribution of these light nuclei in the surface part. It can be remarked
after observing the figures that the symmetry energy decreases with the increase of
neutron number while pressure and symmetry energy curvature increase with neutron
number for an isotopic series.