

174
M. M. Aggarwal
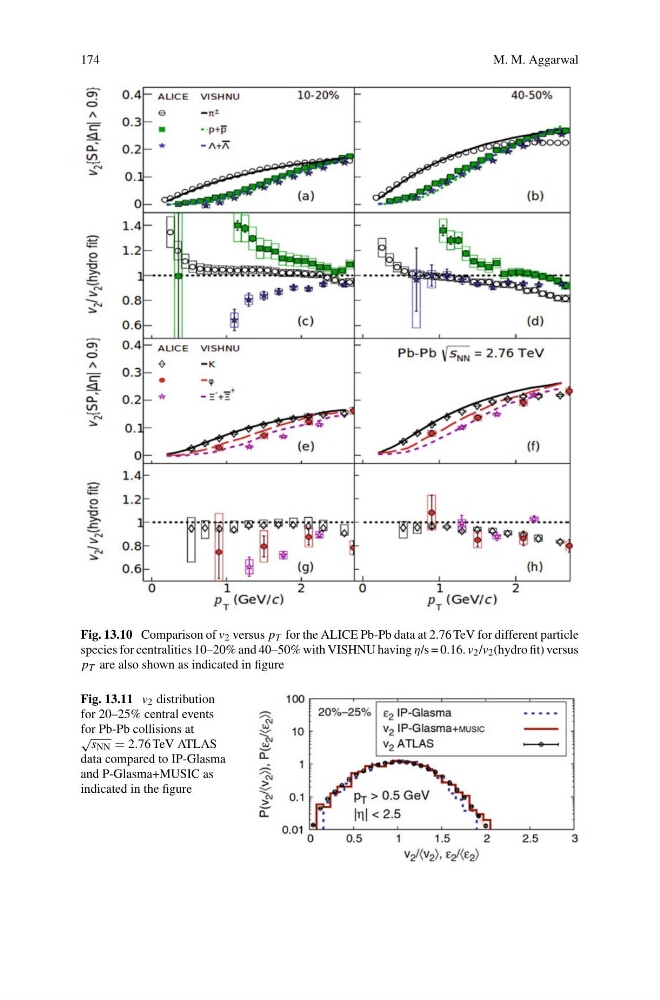
Fig. 13.10 Comparison of v 2 versus p T for the ALICE Pb-Pb data at 2.76 TeV for different particle
species for centralities 10–20% and 40–50% with VISHNU having η/s = 0.16. v 2 /v 2 (hydro fit) versus
p T are also shown as indicated in figure
Fig. 13.11 v 2 distribution
for 20–25% central events
for Pb-Pb collisions at
√
s NN = 2.76 TeV ATLAS
data compared to IP-Glasma
and P-Glasma+MUSIC as
indicated in the figure
M. M. Aggarwal
Fig. 13.10 Comparison of v 2 versus p T for the ALICE Pb-Pb data at 2.76 TeV for different particle
species for centralities 10–20% and 40–50% with VISHNU having η/s = 0.16. v 2 /v 2 (hydro fit) versus
p T are also shown as indicated in figure
Fig. 13.11 v 2 distribution
for 20–25% central events
for Pb-Pb collisions at
√
s NN = 2.76 TeV ATLAS
data compared to IP-Glasma
and P-Glasma+MUSIC as
indicated in the figure