

3.3 Mission Analysis
73
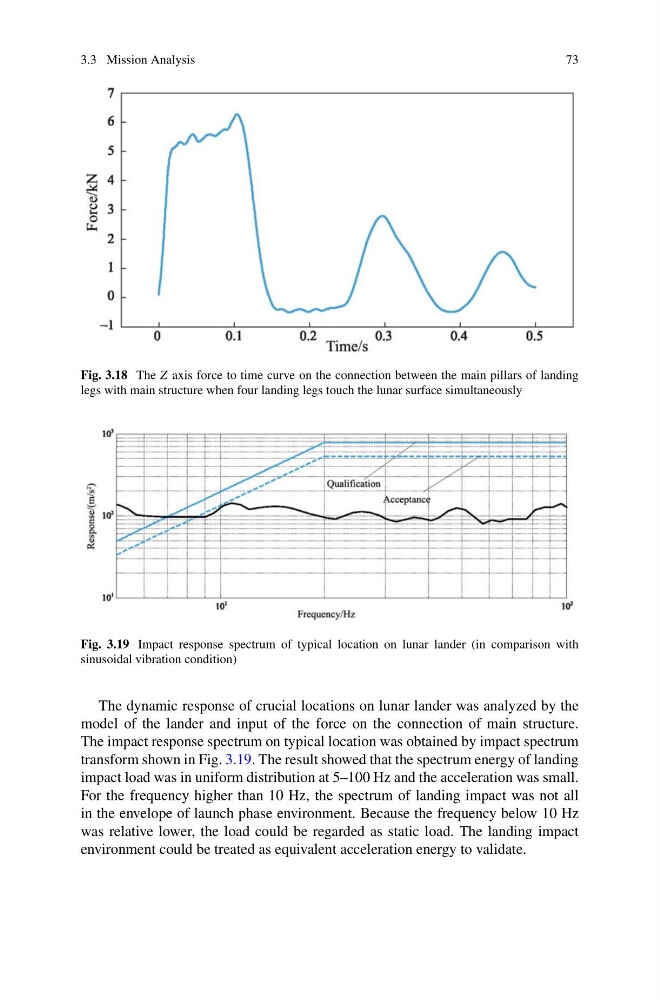
Fig. 3.18 The Z axis force to time curve on the connection between the main pillars of landing
legs with main structure when four landing legs touch the lunar surface simultaneously
Fig. 3.19 Impact response spectrum of typical location on lunar lander (in comparison with
sinusoidal vibration condition)
The dynamic response of crucial locations on lunar lander was analyzed by the
model of the lander and input of the force on the connection of main structure.
The impact response spectrum on typical location was obtained by impact spectrum
transform shown in Fig. 3.19. The result showed that the spectrum energy of landing
impact load was in uniform distribution at 5–100 Hz and the acceleration was small.
For the frequency higher than 10 Hz, the spectrum of landing impact was not all
in the envelope of launch phase environment. Because the frequency below 10 Hz
was relative lower, the load could be regarded as static load. The landing impact
environment could be treated as equivalent acceleration energy to validate.
73
Fig. 3.18 The Z axis force to time curve on the connection between the main pillars of landing
legs with main structure when four landing legs touch the lunar surface simultaneously
Fig. 3.19 Impact response spectrum of typical location on lunar lander (in comparison with
sinusoidal vibration condition)
The dynamic response of crucial locations on lunar lander was analyzed by the
model of the lander and input of the force on the connection of main structure.
The impact response spectrum on typical location was obtained by impact spectrum
transform shown in Fig. 3.19. The result showed that the spectrum energy of landing
impact load was in uniform distribution at 5–100 Hz and the acceleration was small.
For the frequency higher than 10 Hz, the spectrum of landing impact was not all
in the envelope of launch phase environment. Because the frequency below 10 Hz
was relative lower, the load could be regarded as static load. The landing impact
environment could be treated as equivalent acceleration energy to validate.