

43
utilize it at the right place according to the characteristics of each car. The emergence of a variety of mobility has brought about the joy of making choices, and new
business opportunities are being created. CO 2 emission reduction and affluence are
concepts that can fully coexist.
3.2.5 Modal Shift in Movement
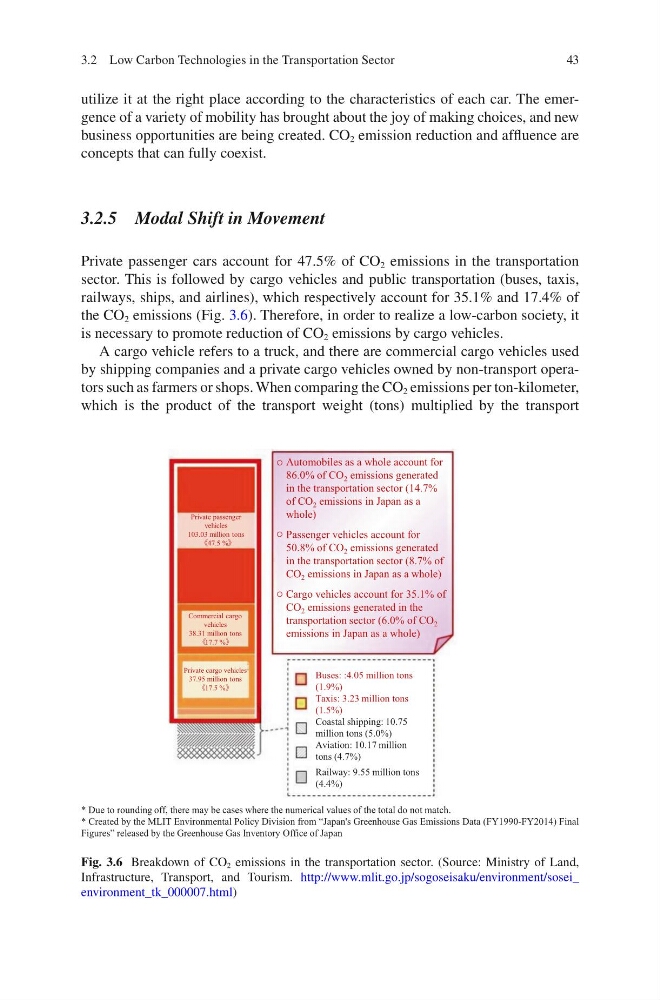
Private passenger cars account for 47.5% of CO 2 emissions in the transportation
sector. This is followed by cargo vehicles and public transportation (buses, taxis,
railways, ships, and airlines), which respectively account for 35.1% and 17.4% of
the CO 2 emissions (Fig. 3.6). Therefore, in order to realize a low-carbon society, it
is necessary to promote reduction of CO 2 emissions by cargo vehicles.
A cargo vehicle refers to a truck, and there are commercial cargo vehicles used
by shipping companies and a private cargo vehicles owned by non-transport operators such as farmers or shops. When comparing the CO 2 emissions per ton- kilometer,
which is the product of the transport weight (tons) multiplied by the transport
Private passenger
vehicles
103.03 million tons
47.5 %
Commercial cargo
vehicles
38.31 million tons
17.7 %
Private cargo vehicles
37.95 million tons
17.5 %
Automobiles as a whole account for
86.0% of CO 2 emissions generated
in the transportation sector (14.7%
of CO 2 emissions in Japan as a
whole)
Passenger vehicles account for
50.8% of CO 2 emissions generated
in the transportation sector (8.7% of
CO 2 emissions in Japan as a whole)
Cargo vehicles account for 35.1% of
CO 2 emissions generated in the
transportation sector (6.0% of CO 2
emissions in Japan as a whole)
Buses: :4.05 million tons
(1.9%)
Taxis: 3.23 million tons
(1.5%)
Coastal shipping: 10.75
million tons (5.0%)
Aviation: 10.17 million
tons (4.7%)
Railway: 9.55 million tons
(4.4%)
* Due to rounding off, there may be cases where the numerical values of the total do not match.
* Created by the MLIT Environmental Policy Division from “Japan's Greenhouse Gas Emissions Data (FY1990-FY2014) Final
Figures” released by the Greenhouse Gas Inventory Office of Japan
Fig. 3.6 Breakdown of CO 2 emissions in the transportation sector. (Source: Ministry of Land,
Infrastructure, Transport, and Tourism. http://www.mlit.go.jp/sogoseisaku/environment/sosei_
environment_tk_000007.html)
3.2 Low Carbon Technologies in the Transportation Sector
utilize it at the right place according to the characteristics of each car. The emergence of a variety of mobility has brought about the joy of making choices, and new
business opportunities are being created. CO 2 emission reduction and affluence are
concepts that can fully coexist.
3.2.5 Modal Shift in Movement
Private passenger cars account for 47.5% of CO 2 emissions in the transportation
sector. This is followed by cargo vehicles and public transportation (buses, taxis,
railways, ships, and airlines), which respectively account for 35.1% and 17.4% of
the CO 2 emissions (Fig. 3.6). Therefore, in order to realize a low-carbon society, it
is necessary to promote reduction of CO 2 emissions by cargo vehicles.
A cargo vehicle refers to a truck, and there are commercial cargo vehicles used
by shipping companies and a private cargo vehicles owned by non-transport operators such as farmers or shops. When comparing the CO 2 emissions per ton- kilometer,
which is the product of the transport weight (tons) multiplied by the transport
Private passenger
vehicles
103.03 million tons
47.5 %
Commercial cargo
vehicles
38.31 million tons
17.7 %
Private cargo vehicles
37.95 million tons
17.5 %
Automobiles as a whole account for
86.0% of CO 2 emissions generated
in the transportation sector (14.7%
of CO 2 emissions in Japan as a
whole)
Passenger vehicles account for
50.8% of CO 2 emissions generated
in the transportation sector (8.7% of
CO 2 emissions in Japan as a whole)
Cargo vehicles account for 35.1% of
CO 2 emissions generated in the
transportation sector (6.0% of CO 2
emissions in Japan as a whole)
Buses: :4.05 million tons
(1.9%)
Taxis: 3.23 million tons
(1.5%)
Coastal shipping: 10.75
million tons (5.0%)
Aviation: 10.17 million
tons (4.7%)
Railway: 9.55 million tons
(4.4%)
* Due to rounding off, there may be cases where the numerical values of the total do not match.
* Created by the MLIT Environmental Policy Division from “Japan's Greenhouse Gas Emissions Data (FY1990-FY2014) Final
Figures” released by the Greenhouse Gas Inventory Office of Japan
Fig. 3.6 Breakdown of CO 2 emissions in the transportation sector. (Source: Ministry of Land,
Infrastructure, Transport, and Tourism. http://www.mlit.go.jp/sogoseisaku/environment/sosei_
environment_tk_000007.html)
3.2 Low Carbon Technologies in the Transportation Sector