

21
for man-made objects that are large enough to affect the total amount, it is for
objects at the final stage like automobiles and buildings. I have already spoken of
automobiles and houses, but if you look at most of the cities in the world you can
get a visceral sense that buildings are at saturation, too.
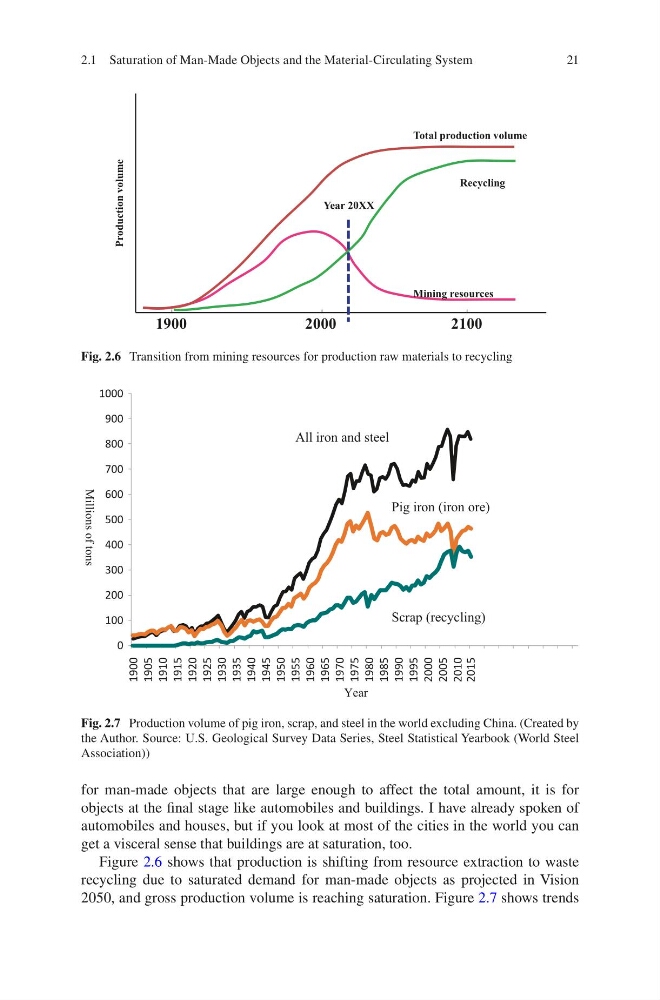
Figure 2.6 shows that production is shifting from resource extraction to waste
recycling due to saturated demand for man-made objects as projected in Vision
2050, and gross production volume is reaching saturation. Figure 2.7 shows trends
1900
2000
2100
Production volume
Total production volume
Recycling
Mining resources
Year 20XX
Fig. 2.6 Transition from mining resources for production raw materials to recycling
0
100
200
300
400
500
600
700
800
900
1000
1900
1905
1910
1915
1920
1925
1930
1935
1940
1945
1950
1955
1960
1965
1970
1975
1980
1985
1990
1995
2000
2005
2010
2015
All iron and steel
Pig iron (iron ore)
Scrap (recycling)
Millions of tons
Year
Fig. 2.7 Production volume of pig iron, scrap, and steel in the world excluding China. (Created by
the Author. Source: U.S. Geological Survey Data Series, Steel Statistical Yearbook (World Steel
Association))
2.1 Saturation of Man-Made Objects and the Material-Circulating System
for man-made objects that are large enough to affect the total amount, it is for
objects at the final stage like automobiles and buildings. I have already spoken of
automobiles and houses, but if you look at most of the cities in the world you can
get a visceral sense that buildings are at saturation, too.
Figure 2.6 shows that production is shifting from resource extraction to waste
recycling due to saturated demand for man-made objects as projected in Vision
2050, and gross production volume is reaching saturation. Figure 2.7 shows trends
1900
2000
2100
Production volume
Total production volume
Recycling
Mining resources
Year 20XX
Fig. 2.6 Transition from mining resources for production raw materials to recycling
0
100
200
300
400
500
600
700
800
900
1000
1900
1905
1910
1915
1920
1925
1930
1935
1940
1945
1950
1955
1960
1965
1970
1975
1980
1985
1990
1995
2000
2005
2010
2015
All iron and steel
Pig iron (iron ore)
Scrap (recycling)
Millions of tons
Year
Fig. 2.7 Production volume of pig iron, scrap, and steel in the world excluding China. (Created by
the Author. Source: U.S. Geological Survey Data Series, Steel Statistical Yearbook (World Steel
Association))
2.1 Saturation of Man-Made Objects and the Material-Circulating System