

28
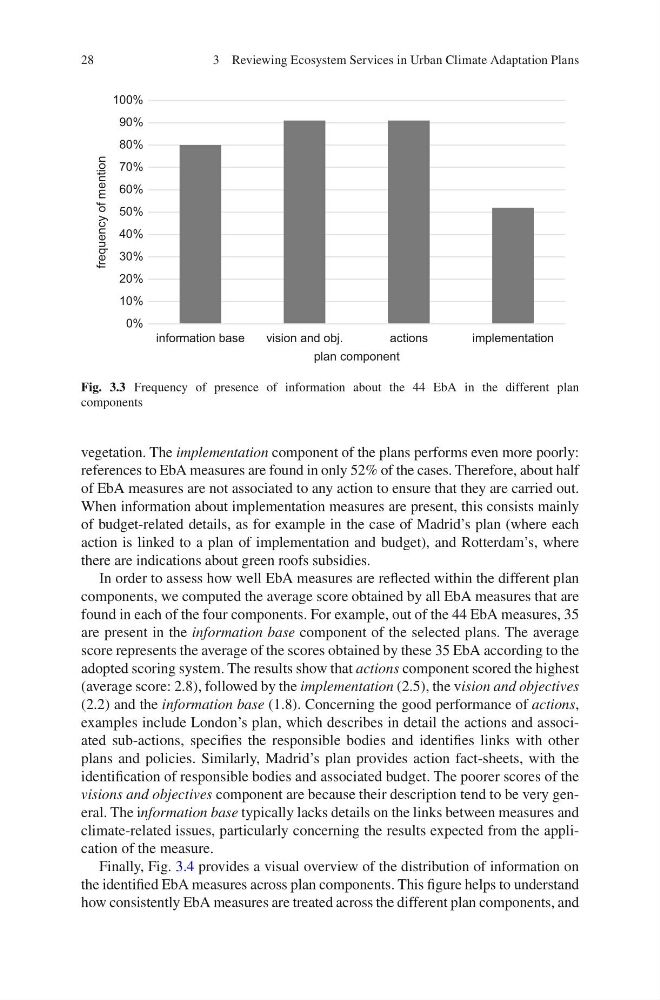
vegetation. The implementation component of the plans performs even more poorly:
references to EbA measures are found in only 52% of the cases. Therefore, about half
of EbA measures are not associated to any action to ensure that they are carried out.
When information about implementation measures are present, this consists mainly
of budget-related details, as for example in the case of Madrid’s plan (where each
action is linked to a plan of implementation and budget), and Rotterdam’s, where
there are indications about green roofs subsidies.
In order to assess how well EbA measures are reflected within the different plan
components, we computed the average score obtained by all EbA measures that are
found in each of the four components. For example, out of the 44 EbA measures, 35
are present in the information base component of the selected plans. The average
score represents the average of the scores obtained by these 35 EbA according to the
adopted scoring system. The results show that actions component scored the highest
(average score: 2.8), followed by the implementation (2.5), the vision and objectives
(2.2) and the information base (1.8). Concerning the good performance of actions,
examples include London’s plan, which describes in detail the actions and associated sub-actions, specifies the responsible bodies and identifies links with other
plans and policies. Similarly, Madrid’s plan provides action fact-sheets, with the
identification of responsible bodies and associated budget. The poorer scores of the
visions and objectives component are because their description tend to be very general. The information base typically lacks details on the links between measures and
climate-related issues, particularly concerning the results expected from the application of the measure.
Finally, Fig. 3.4 provides a visual overview of the distribution of information on
the identified EbA measures across plan components. This figure helps to understand
how consistently EbA measures are treated across the different plan components, and
0%
10%
20%
30%
40%
50%
60%
70%
80%
90%
100%
information base
vision and obj.
actions
i mplementation
frequency of mention
plan component
Fig. 3.3 Frequency of presence of information about the 44 EbA in the different plan
components
3 Reviewing Ecosystem Services in Urban Climate Adaptation Plans
vegetation. The implementation component of the plans performs even more poorly:
references to EbA measures are found in only 52% of the cases. Therefore, about half
of EbA measures are not associated to any action to ensure that they are carried out.
When information about implementation measures are present, this consists mainly
of budget-related details, as for example in the case of Madrid’s plan (where each
action is linked to a plan of implementation and budget), and Rotterdam’s, where
there are indications about green roofs subsidies.
In order to assess how well EbA measures are reflected within the different plan
components, we computed the average score obtained by all EbA measures that are
found in each of the four components. For example, out of the 44 EbA measures, 35
are present in the information base component of the selected plans. The average
score represents the average of the scores obtained by these 35 EbA according to the
adopted scoring system. The results show that actions component scored the highest
(average score: 2.8), followed by the implementation (2.5), the vision and objectives
(2.2) and the information base (1.8). Concerning the good performance of actions,
examples include London’s plan, which describes in detail the actions and associated sub-actions, specifies the responsible bodies and identifies links with other
plans and policies. Similarly, Madrid’s plan provides action fact-sheets, with the
identification of responsible bodies and associated budget. The poorer scores of the
visions and objectives component are because their description tend to be very general. The information base typically lacks details on the links between measures and
climate-related issues, particularly concerning the results expected from the application of the measure.
Finally, Fig. 3.4 provides a visual overview of the distribution of information on
the identified EbA measures across plan components. This figure helps to understand
how consistently EbA measures are treated across the different plan components, and
0%
10%
20%
30%
40%
50%
60%
70%
80%
90%
100%
information base
vision and obj.
actions
i mplementation
frequency of mention
plan component
Fig. 3.3 Frequency of presence of information about the 44 EbA in the different plan
components
3 Reviewing Ecosystem Services in Urban Climate Adaptation Plans