

320
S. Lee
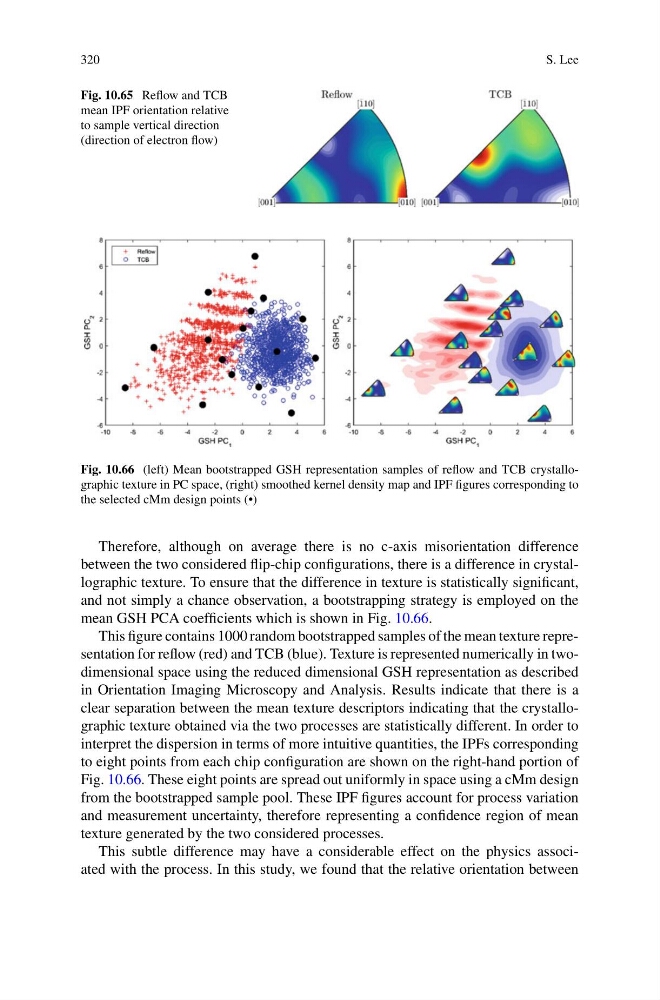
Fig. 10.65 Reflow and TCB
mean IPF orientation relative
to sample vertical direction
(direction of electron flow)
Fig. 10.66 (left) Mean bootstrapped GSH representation samples of reflow and TCB crystallographic texture in PC space, (right) smoothed kernel density map and IPF figures corresponding to
the selected cMm design points (•)
Therefore, although on average there is no c-axis misorientation difference
between the two considered flip-chip configurations, there is a difference in crystallographic texture. To ensure that the difference in texture is statistically significant,
and not simply a chance observation, a bootstrapping strategy is employed on the
mean GSH PCA coefficients which is shown in Fig. 10.66.
This figure contains 1000 random bootstrapped samples of the mean texture representation for reflow (red) and TCB (blue). Texture is represented numerically in twodimensional space using the reduced dimensional GSH representation as described
in Orientation Imaging Microscopy and Analysis. Results indicate that there is a
clear separation between the mean texture descriptors indicating that the crystallographic texture obtained via the two processes are statistically different. In order to
interpret the dispersion in terms of more intuitive quantities, the IPFs corresponding
to eight points from each chip configuration are shown on the right-hand portion of
Fig. 10.66. These eight points are spread out uniformly in space using a cMm design
from the bootstrapped sample pool. These IPF figures account for process variation
and measurement uncertainty, therefore representing a confidence region of mean
texture generated by the two considered processes.
This subtle difference may have a considerable effect on the physics associated with the process. In this study, we found that the relative orientation between
S. Lee
Fig. 10.65 Reflow and TCB
mean IPF orientation relative
to sample vertical direction
(direction of electron flow)
Fig. 10.66 (left) Mean bootstrapped GSH representation samples of reflow and TCB crystallographic texture in PC space, (right) smoothed kernel density map and IPF figures corresponding to
the selected cMm design points (•)
Therefore, although on average there is no c-axis misorientation difference
between the two considered flip-chip configurations, there is a difference in crystallographic texture. To ensure that the difference in texture is statistically significant,
and not simply a chance observation, a bootstrapping strategy is employed on the
mean GSH PCA coefficients which is shown in Fig. 10.66.
This figure contains 1000 random bootstrapped samples of the mean texture representation for reflow (red) and TCB (blue). Texture is represented numerically in twodimensional space using the reduced dimensional GSH representation as described
in Orientation Imaging Microscopy and Analysis. Results indicate that there is a
clear separation between the mean texture descriptors indicating that the crystallographic texture obtained via the two processes are statistically different. In order to
interpret the dispersion in terms of more intuitive quantities, the IPFs corresponding
to eight points from each chip configuration are shown on the right-hand portion of
Fig. 10.66. These eight points are spread out uniformly in space using a cMm design
from the bootstrapped sample pool. These IPF figures account for process variation
and measurement uncertainty, therefore representing a confidence region of mean
texture generated by the two considered processes.
This subtle difference may have a considerable effect on the physics associated with the process. In this study, we found that the relative orientation between