

250
Y. Dai and C. S. Tan
but this happens in the nano-particles paste. Sheet resistance measurement was then
conducted to eliminate the thickness variation. The mixed paste has good conductivity than micro-particle and nano-particle paste. Also, the macro cracks formed in
the nano-particles paste substantiates the resistance increase in the in situ measurement. This is again verified by the SEM image analysis. The porosity ratio shows
that the mixed paste is more compact than the micro-particles paste.
To find the optimum mixture ratio, the mixed paste with 1:3, 1:1, 3:1, 6:1, and 9:1
mixing ratios (micro: nano) were made. The results reveal that the 1:3 mixed paste
exhibits small cracks and the 9:1 paste has more porosity than the other mixed pastes.
All these experimental data illustrate that the mixed paste performs better than the
micro-particles and nano-particles pastes and the 3:1 is the optimum mixture ratio.
9.4 Demonstration of Die to Wafer Bonding
Die to wafer bonding was conducted to study the interconnects mechanical property using micro-particles, nano-particles and mixed paste as an intermediate. After
bonding, shear test and the fracture interfaces observation are used to analyse the
paste bonding failure modes.
9.4.1 Experimental Details
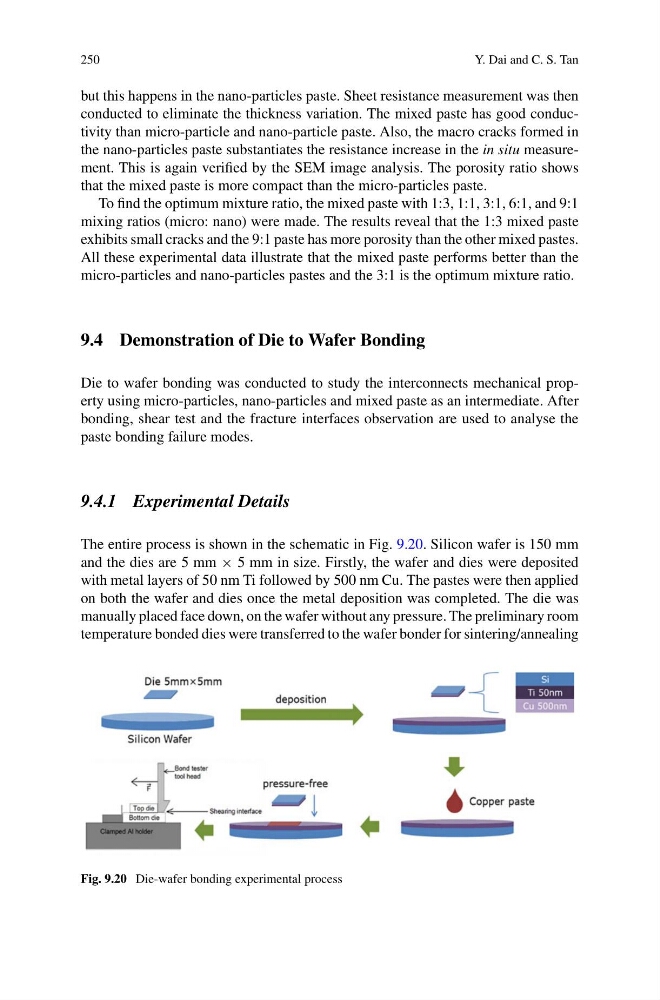
The entire process is shown in the schematic in Fig. 9.20. Silicon wafer is 150 mm
and the dies are 5 mm × 5 mm in size. Firstly, the wafer and dies were deposited
with metal layers of 50 nm Ti followed by 500 nm Cu. The pastes were then applied
on both the wafer and dies once the metal deposition was completed. The die was
manually placed face down, on the wafer without any pressure. The preliminary room
temperature bonded dies were transferred to the wafer bonder for sintering/annealing
Fig. 9.20 Die-wafer bonding experimental process
Y. Dai and C. S. Tan
but this happens in the nano-particles paste. Sheet resistance measurement was then
conducted to eliminate the thickness variation. The mixed paste has good conductivity than micro-particle and nano-particle paste. Also, the macro cracks formed in
the nano-particles paste substantiates the resistance increase in the in situ measurement. This is again verified by the SEM image analysis. The porosity ratio shows
that the mixed paste is more compact than the micro-particles paste.
To find the optimum mixture ratio, the mixed paste with 1:3, 1:1, 3:1, 6:1, and 9:1
mixing ratios (micro: nano) were made. The results reveal that the 1:3 mixed paste
exhibits small cracks and the 9:1 paste has more porosity than the other mixed pastes.
All these experimental data illustrate that the mixed paste performs better than the
micro-particles and nano-particles pastes and the 3:1 is the optimum mixture ratio.
9.4 Demonstration of Die to Wafer Bonding
Die to wafer bonding was conducted to study the interconnects mechanical property using micro-particles, nano-particles and mixed paste as an intermediate. After
bonding, shear test and the fracture interfaces observation are used to analyse the
paste bonding failure modes.
9.4.1 Experimental Details
The entire process is shown in the schematic in Fig. 9.20. Silicon wafer is 150 mm
and the dies are 5 mm × 5 mm in size. Firstly, the wafer and dies were deposited
with metal layers of 50 nm Ti followed by 500 nm Cu. The pastes were then applied
on both the wafer and dies once the metal deposition was completed. The die was
manually placed face down, on the wafer without any pressure. The preliminary room
temperature bonded dies were transferred to the wafer bonder for sintering/annealing
Fig. 9.20 Die-wafer bonding experimental process