

246
Y. Dai and C. S. Tan
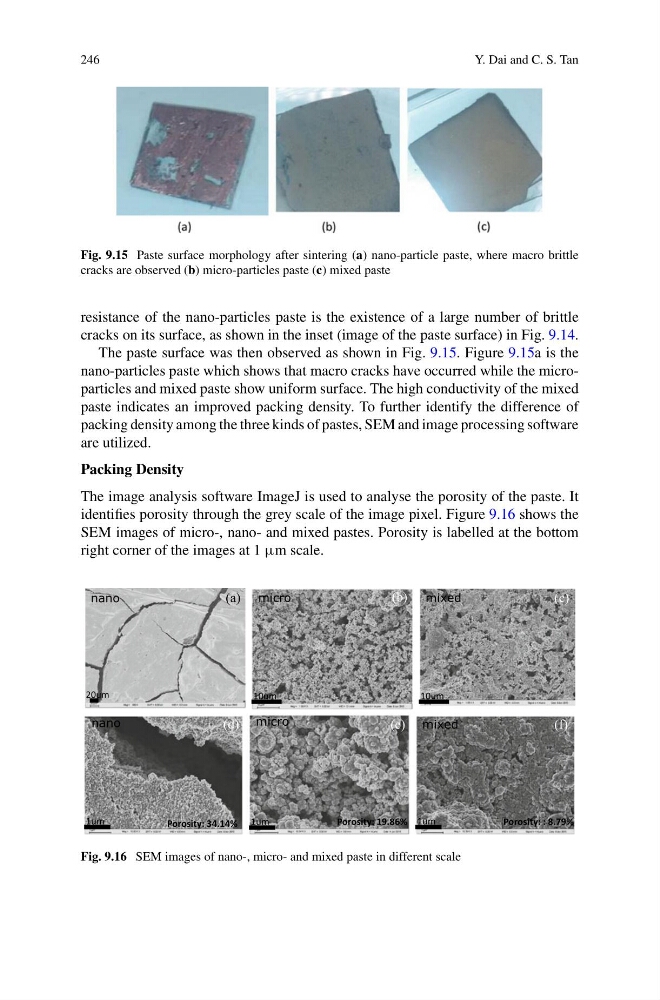
Fig. 9.15 Paste surface morphology after sintering (a) nano-particle paste, where macro brittle
cracks are observed (b) micro-particles paste (c) mixed paste
resistance of the nano-particles paste is the existence of a large number of brittle
cracks on its surface, as shown in the inset (image of the paste surface) in Fig. 9.14.
The paste surface was then observed as shown in Fig. 9.15. Figure 9.15a is the
nano-particles paste which shows that macro cracks have occurred while the microparticles and mixed paste show uniform surface. The high conductivity of the mixed
paste indicates an improved packing density. To further identify the difference of
packing density among the three kinds of pastes, SEM and image processing software
are utilized.
Packing Density
The image analysis software ImageJ is used to analyse the porosity of the paste. It
identifies porosity through the grey scale of the image pixel. Figure 9.16 shows the
SEM images of micro-, nano- and mixed pastes. Porosity is labelled at the bottom
right corner of the images at 1 μm scale.
20um
nano
micro
mixed
1um
1um
Porosity: 19.86%
Porosity: : 8.79%
1um
Porosity: 34.14%
nano
10um
10um
micro
mixed
(a)
(b)
(c)
(d)
(e)
(f)
Fig. 9.16 SEM images of nano-, micro- and mixed paste in different scale
Y. Dai and C. S. Tan
Fig. 9.15 Paste surface morphology after sintering (a) nano-particle paste, where macro brittle
cracks are observed (b) micro-particles paste (c) mixed paste
resistance of the nano-particles paste is the existence of a large number of brittle
cracks on its surface, as shown in the inset (image of the paste surface) in Fig. 9.14.
The paste surface was then observed as shown in Fig. 9.15. Figure 9.15a is the
nano-particles paste which shows that macro cracks have occurred while the microparticles and mixed paste show uniform surface. The high conductivity of the mixed
paste indicates an improved packing density. To further identify the difference of
packing density among the three kinds of pastes, SEM and image processing software
are utilized.
Packing Density
The image analysis software ImageJ is used to analyse the porosity of the paste. It
identifies porosity through the grey scale of the image pixel. Figure 9.16 shows the
SEM images of micro-, nano- and mixed pastes. Porosity is labelled at the bottom
right corner of the images at 1 μm scale.
20um
nano
micro
mixed
1um
1um
Porosity: 19.86%
Porosity: : 8.79%
1um
Porosity: 34.14%
nano
10um
10um
micro
mixed
(a)
(b)
(c)
(d)
(e)
(f)
Fig. 9.16 SEM images of nano-, micro- and mixed paste in different scale