

150
J. Liu et al.
Table 6.2 A list of R a and λ a for models MSR1-MSR7 and protrusion data.
Model no.
R a
λ a
Mean protrusion
(a)
Maximum
protrusion (a)
MSR1
10
40π
4.7
7.6
MSR2
20
40π
4.5
7.6
MSR3
30
40π
4.3
8.2
MSR4
40
40π
3.8
7.4
MSR5
20
30π
3.0
4.6
MSR6
20
20π
4.2
7.3
MSR7
20
10π
5.0
9.3
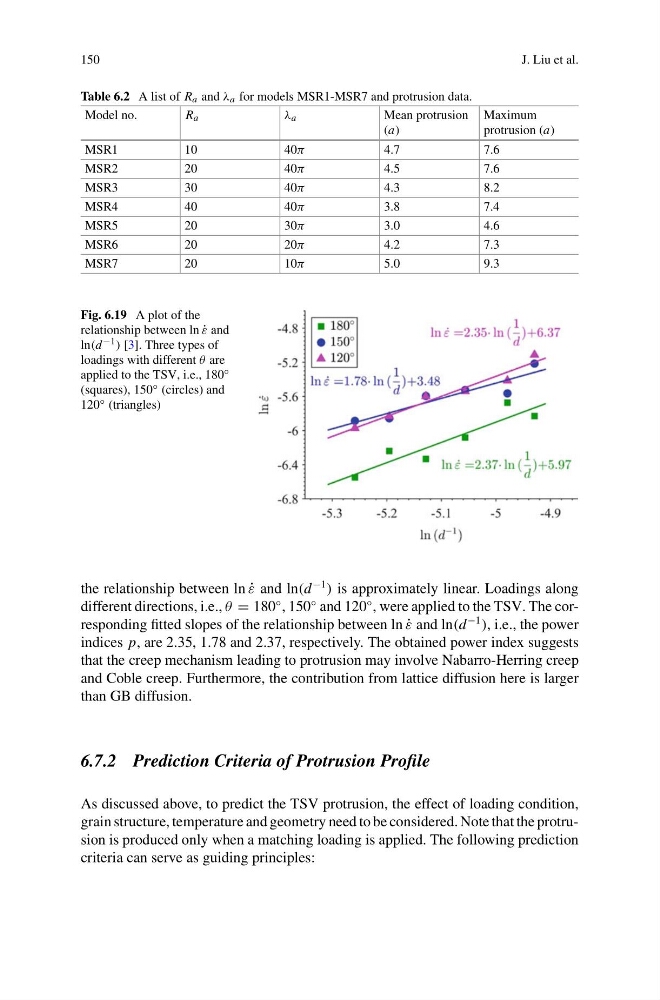
Fig. 6.19 A plot of the
relationship between ln ˙
ε and
ln(d −1 ) [3]. Three types of
loadings with different θ are
applied to the TSV, i.e., 180 ◦
(squares), 150 ◦ (circles) and
120 ◦ (triangles)
the relationship between ln ˙
ε and ln(d
−1
) is approximately linear. Loadings along
different directions, i.e., θ = 180
◦ , 150
◦ and 120
◦ , were applied to the TSV. The corresponding fitted slopes of the relationship between ln ˙
ε and ln(d
−1
), i.e., the power
indices p, are 2.35, 1.78 and 2.37, respectively. The obtained power index suggests
that the creep mechanism leading to protrusion may involve Nabarro-Herring creep
and Coble creep. Furthermore, the contribution from lattice diffusion here is larger
than GB diffusion.
6.7.2 Prediction Criteria of Protrusion Profile
As discussed above, to predict the TSV protrusion, the effect of loading condition,
grain structure, temperature and geometry need to be considered. Note that the protrusion is produced only when a matching loading is applied. The following prediction
criteria can serve as guiding principles:
J. Liu et al.
Table 6.2 A list of R a and λ a for models MSR1-MSR7 and protrusion data.
Model no.
R a
λ a
Mean protrusion
(a)
Maximum
protrusion (a)
MSR1
10
40π
4.7
7.6
MSR2
20
40π
4.5
7.6
MSR3
30
40π
4.3
8.2
MSR4
40
40π
3.8
7.4
MSR5
20
30π
3.0
4.6
MSR6
20
20π
4.2
7.3
MSR7
20
10π
5.0
9.3
Fig. 6.19 A plot of the
relationship between ln ˙
ε and
ln(d −1 ) [3]. Three types of
loadings with different θ are
applied to the TSV, i.e., 180 ◦
(squares), 150 ◦ (circles) and
120 ◦ (triangles)
the relationship between ln ˙
ε and ln(d
−1
) is approximately linear. Loadings along
different directions, i.e., θ = 180
◦ , 150
◦ and 120
◦ , were applied to the TSV. The corresponding fitted slopes of the relationship between ln ˙
ε and ln(d
−1
), i.e., the power
indices p, are 2.35, 1.78 and 2.37, respectively. The obtained power index suggests
that the creep mechanism leading to protrusion may involve Nabarro-Herring creep
and Coble creep. Furthermore, the contribution from lattice diffusion here is larger
than GB diffusion.
6.7.2 Prediction Criteria of Protrusion Profile
As discussed above, to predict the TSV protrusion, the effect of loading condition,
grain structure, temperature and geometry need to be considered. Note that the protrusion is produced only when a matching loading is applied. The following prediction
criteria can serve as guiding principles: