

6 Atomic Scale Kinetics of TSV Protrusion
139
(a)
(b)
(c)
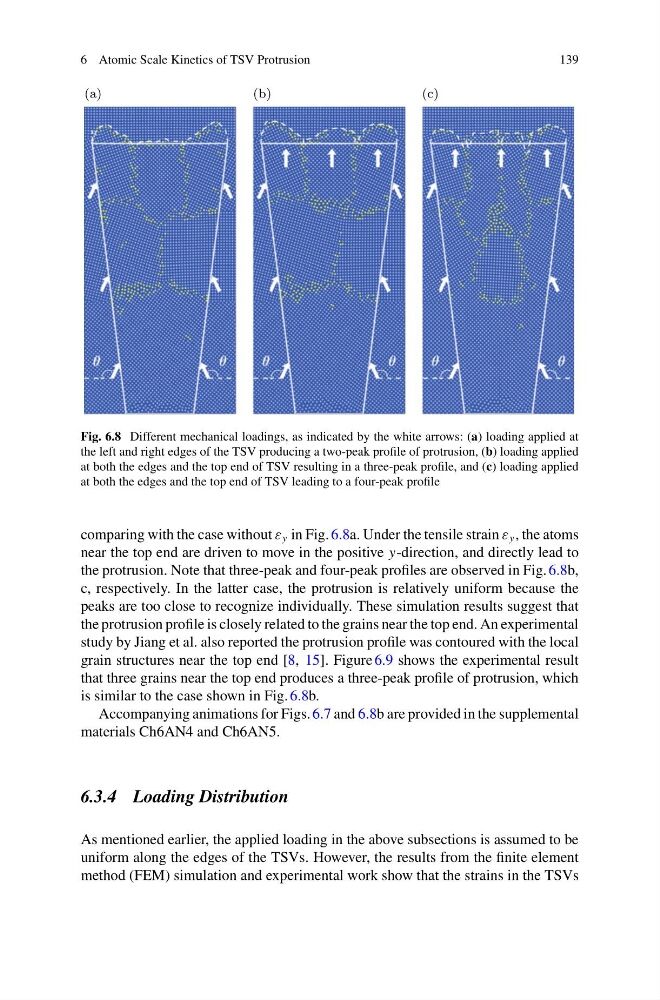
Fig. 6.8 Different mechanical loadings, as indicated by the white arrows: (a) loading applied at
the left and right edges of the TSV producing a two-peak profile of protrusion, (b) loading applied
at both the edges and the top end of TSV resulting in a three-peak profile, and (c) loading applied
at both the edges and the top end of TSV leading to a four-peak profile
comparing with the case without ε y in Fig. 6.8a. Under the tensile strain ε y , the atoms
near the top end are driven to move in the positive y-direction, and directly lead to
the protrusion. Note that three-peak and four-peak profiles are observed in Fig. 6.8b,
c, respectively. In the latter case, the protrusion is relatively uniform because the
peaks are too close to recognize individually. These simulation results suggest that
the protrusion profile is closely related to the grains near the top end. An experimental
study by Jiang et al. also reported the protrusion profile was contoured with the local
grain structures near the top end [8, 15]. Figure 6.9 shows the experimental result
that three grains near the top end produces a three-peak profile of protrusion, which
is similar to the case shown in Fig. 6.8b.
Accompanying animations for Figs. 6.7 and 6.8b are provided in the supplemental
materials Ch6AN4 and Ch6AN5.
6.3.4 Loading Distribution
As mentioned earlier, the applied loading in the above subsections is assumed to be
uniform along the edges of the TSVs. However, the results from the finite element
method (FEM) simulation and experimental work show that the strains in the TSVs
139
(a)
(b)
(c)
Fig. 6.8 Different mechanical loadings, as indicated by the white arrows: (a) loading applied at
the left and right edges of the TSV producing a two-peak profile of protrusion, (b) loading applied
at both the edges and the top end of TSV resulting in a three-peak profile, and (c) loading applied
at both the edges and the top end of TSV leading to a four-peak profile
comparing with the case without ε y in Fig. 6.8a. Under the tensile strain ε y , the atoms
near the top end are driven to move in the positive y-direction, and directly lead to
the protrusion. Note that three-peak and four-peak profiles are observed in Fig. 6.8b,
c, respectively. In the latter case, the protrusion is relatively uniform because the
peaks are too close to recognize individually. These simulation results suggest that
the protrusion profile is closely related to the grains near the top end. An experimental
study by Jiang et al. also reported the protrusion profile was contoured with the local
grain structures near the top end [8, 15]. Figure 6.9 shows the experimental result
that three grains near the top end produces a three-peak profile of protrusion, which
is similar to the case shown in Fig. 6.8b.
Accompanying animations for Figs. 6.7 and 6.8b are provided in the supplemental
materials Ch6AN4 and Ch6AN5.
6.3.4 Loading Distribution
As mentioned earlier, the applied loading in the above subsections is assumed to be
uniform along the edges of the TSVs. However, the results from the finite element
method (FEM) simulation and experimental work show that the strains in the TSVs