

136
J. Liu et al.
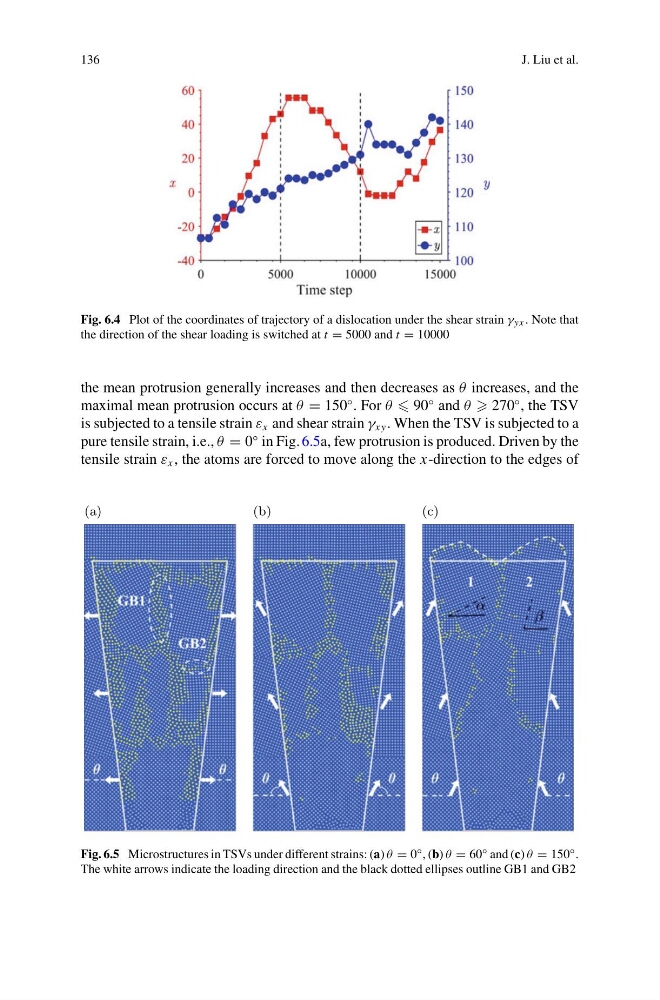
Fig. 6.4 Plot of the coordinates of trajectory of a dislocation under the shear strain γ yx . Note that
the direction of the shear loading is switched at t = 5000 and t = 10000
the mean protrusion generally increases and then decreases as θ increases, and the
maximal mean protrusion occurs at θ = 150
◦ . For θ 90
◦ and θ 270
◦ , the TSV
is subjected to a tensile strain ε x and shear strain γ xy . When the TSV is subjected to a
pure tensile strain, i.e., θ = 0
◦ in Fig. 6.5a, few protrusion is produced. Driven by the
tensile strain ε x , the atoms are forced to move along the x-direction to the edges of
(a)
(b)
(c)
Fig. 6.5 Microstructures in TSVs under different strains: (a) θ = 0 ◦ , (b) θ = 60 ◦ and (c) θ = 150 ◦ .
The white arrows indicate the loading direction and the black dotted ellipses outline GB1 and GB2
J. Liu et al.
Fig. 6.4 Plot of the coordinates of trajectory of a dislocation under the shear strain γ yx . Note that
the direction of the shear loading is switched at t = 5000 and t = 10000
the mean protrusion generally increases and then decreases as θ increases, and the
maximal mean protrusion occurs at θ = 150
◦ . For θ 90
◦ and θ 270
◦ , the TSV
is subjected to a tensile strain ε x and shear strain γ xy . When the TSV is subjected to a
pure tensile strain, i.e., θ = 0
◦ in Fig. 6.5a, few protrusion is produced. Driven by the
tensile strain ε x , the atoms are forced to move along the x-direction to the edges of
(a)
(b)
(c)
Fig. 6.5 Microstructures in TSVs under different strains: (a) θ = 0 ◦ , (b) θ = 60 ◦ and (c) θ = 150 ◦ .
The white arrows indicate the loading direction and the black dotted ellipses outline GB1 and GB2