

134
J. Liu et al.
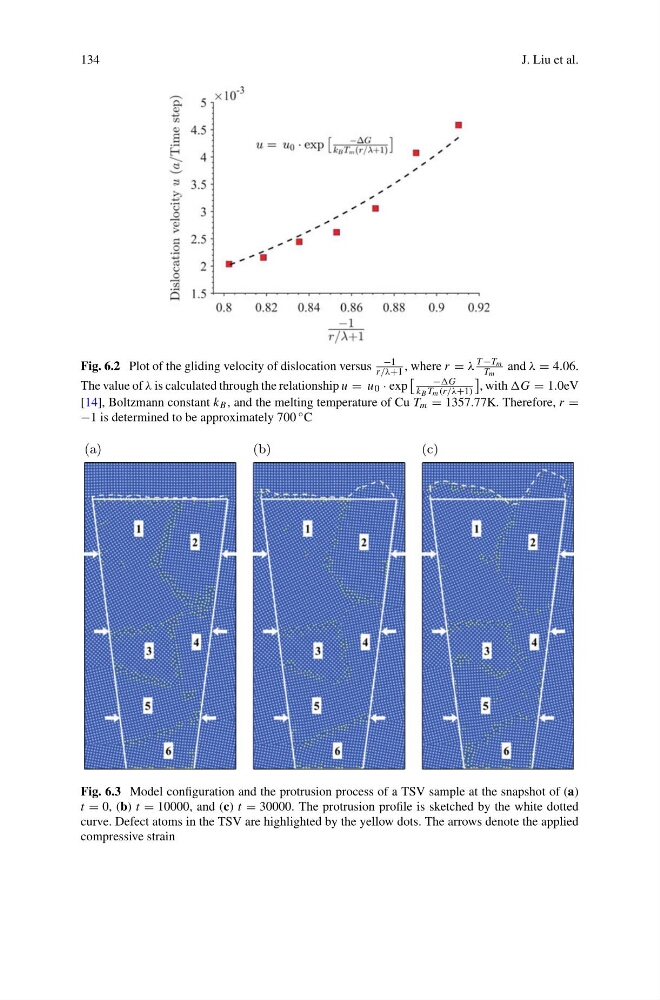
Fig. 6.2 Plot of the gliding velocity of dislocation versus
−1
r/λ+1 , where r = λ
T −Tm
Tm and λ = 4.06.
The value of λ is calculated through the relationship u = u 0 · exp
−
k B Tm (r/λ+1)
, with = 1.0eV
[14], Boltzmann constant k B , and the melting temperature of Cu T m = 1357.77K. Therefore, r =
−1 is determined to be approximately 700 ◦ C
(a)
(b)
(c)
Fig. 6.3 Model configuration and the protrusion process of a TSV sample at the snapshot of (a)
t = 0, (b) t = 10000, and (c) t = 30000. The protrusion profile is sketched by the white dotted
curve. Defect atoms in the TSV are highlighted by the yellow dots. The arrows denote the applied
compressive strain
J. Liu et al.
Fig. 6.2 Plot of the gliding velocity of dislocation versus
−1
r/λ+1 , where r = λ
T −Tm
Tm and λ = 4.06.
The value of λ is calculated through the relationship u = u 0 · exp
−
k B Tm (r/λ+1)
, with = 1.0eV
[14], Boltzmann constant k B , and the melting temperature of Cu T m = 1357.77K. Therefore, r =
−1 is determined to be approximately 700 ◦ C
(a)
(b)
(c)
Fig. 6.3 Model configuration and the protrusion process of a TSV sample at the snapshot of (a)
t = 0, (b) t = 10000, and (c) t = 30000. The protrusion profile is sketched by the white dotted
curve. Defect atoms in the TSV are highlighted by the yellow dots. The arrows denote the applied
compressive strain