

6 Atomic Scale Kinetics of TSV Protrusion
133
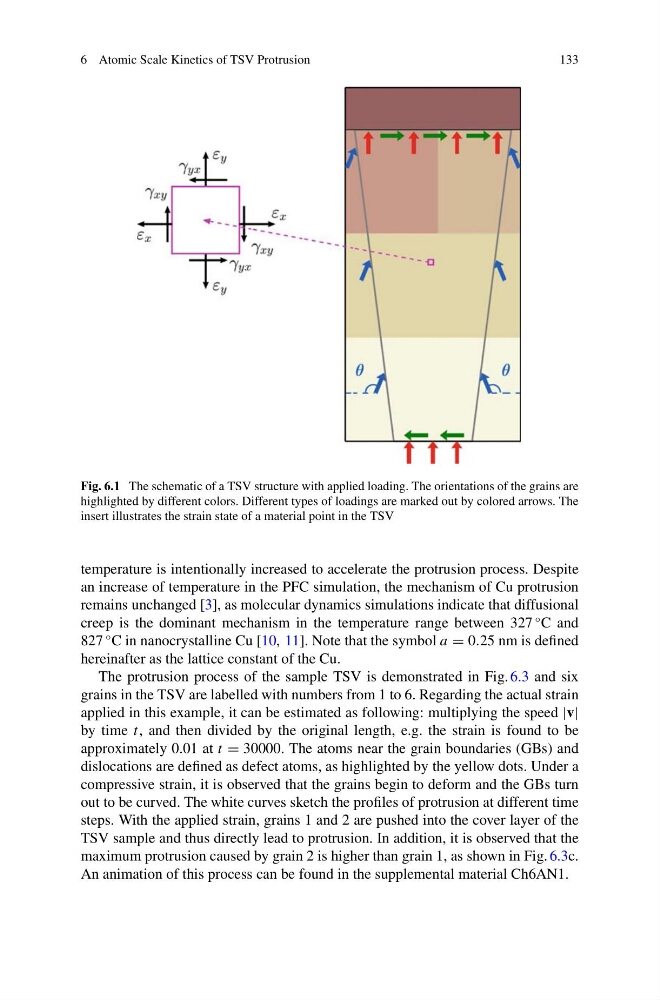
Fig. 6.1 The schematic of a TSV structure with applied loading. The orientations of the grains are
highlighted by different colors. Different types of loadings are marked out by colored arrows. The
insert illustrates the strain state of a material point in the TSV
temperature is intentionally increased to accelerate the protrusion process. Despite
an increase of temperature in the PFC simulation, the mechanism of Cu protrusion
remains unchanged [3], as molecular dynamics simulations indicate that diffusional
creep is the dominant mechanism in the temperature range between 327
◦ C and
827
◦ C in nanocrystalline Cu [10, 11]. Note that the symbol a = 0.25 nm is defined
hereinafter as the lattice constant of the Cu.
The protrusion process of the sample TSV is demonstrated in Fig. 6.3 and six
grains in the TSV are labelled with numbers from 1 to 6. Regarding the actual strain
applied in this example, it can be estimated as following: multiplying the speed |v|
by time t, and then divided by the original length, e.g. the strain is found to be
approximately 0.01 at t = 30000. The atoms near the grain boundaries (GBs) and
dislocations are defined as defect atoms, as highlighted by the yellow dots. Under a
compressive strain, it is observed that the grains begin to deform and the GBs turn
out to be curved. The white curves sketch the profiles of protrusion at different time
steps. With the applied strain, grains 1 and 2 are pushed into the cover layer of the
TSV sample and thus directly lead to protrusion. In addition, it is observed that the
maximum protrusion caused by grain 2 is higher than grain 1, as shown in Fig. 6.3c.
An animation of this process can be found in the supplemental material Ch6AN1.
133
Fig. 6.1 The schematic of a TSV structure with applied loading. The orientations of the grains are
highlighted by different colors. Different types of loadings are marked out by colored arrows. The
insert illustrates the strain state of a material point in the TSV
temperature is intentionally increased to accelerate the protrusion process. Despite
an increase of temperature in the PFC simulation, the mechanism of Cu protrusion
remains unchanged [3], as molecular dynamics simulations indicate that diffusional
creep is the dominant mechanism in the temperature range between 327
◦ C and
827
◦ C in nanocrystalline Cu [10, 11]. Note that the symbol a = 0.25 nm is defined
hereinafter as the lattice constant of the Cu.
The protrusion process of the sample TSV is demonstrated in Fig. 6.3 and six
grains in the TSV are labelled with numbers from 1 to 6. Regarding the actual strain
applied in this example, it can be estimated as following: multiplying the speed |v|
by time t, and then divided by the original length, e.g. the strain is found to be
approximately 0.01 at t = 30000. The atoms near the grain boundaries (GBs) and
dislocations are defined as defect atoms, as highlighted by the yellow dots. Under a
compressive strain, it is observed that the grains begin to deform and the GBs turn
out to be curved. The white curves sketch the profiles of protrusion at different time
steps. With the applied strain, grains 1 and 2 are pushed into the cover layer of the
TSV sample and thus directly lead to protrusion. In addition, it is observed that the
maximum protrusion caused by grain 2 is higher than grain 1, as shown in Fig. 6.3c.
An animation of this process can be found in the supplemental material Ch6AN1.